PhilippvK opened a new pull request, #12522:
URL: https://github.com/apache/tvm/pull/12522
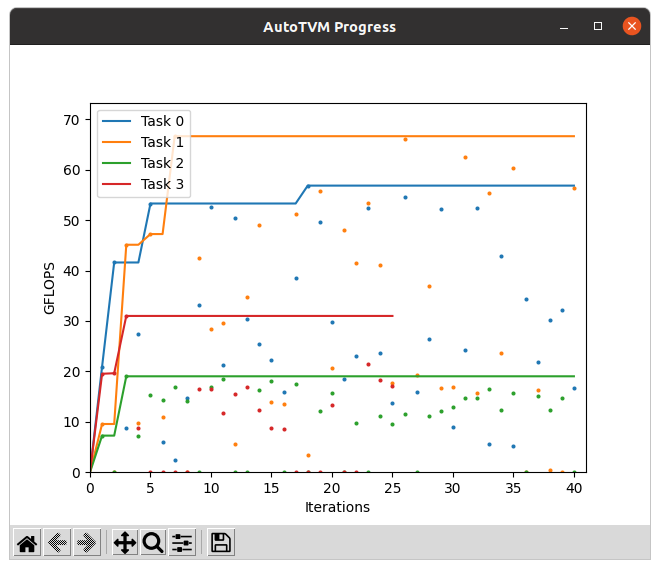
This change adds a callback for visualizing the FLOPS during tuning (AutoTVM
only) over time using Matplotlib.
## Usage
### With Python
Create callback (`multi=False`: 1 window per Task, `multi=True`: all tasks
in a single window):
```
visualize_callback = autotvm.callback.visualize_progress(task_idx,
multi=True)
```
Pass callback to tuner:
```
tuner.tune(
n_trial=100,
measure_option=measure_option,
callbacks=[visualize_callback],
)
```
### With TVM command line
Just add a `--visualize` to the `tvmc tune` command.
## Screenshots
## Additional changes
- Make `si_prefix` in `tvmc/autotuner.py` variable (Prerequisite for a later
PR)
## Open Questions
- How to handle the `matplotlib` python dependency? Should I change ``?
- The graph window automatically closes when the tuning is finished. Do we
need an option to keep it open until closed?
- A similar feature for the AutoScheduler would be nice, too. I can look
into it if there is interest.
- Saving the plot to a file would also be possible. We only need to decide
how to expose this to the cmdline (i.e. `--visualize plot.png`)
--
This is an automated message from the Apache Git Service.
To respond to the message, please log on to GitHub and use the
URL above to go to the specific comment.
To unsubscribe, e-mail: [email protected]
For queries about this service, please contact Infrastructure at:
[email protected]