Hi all,
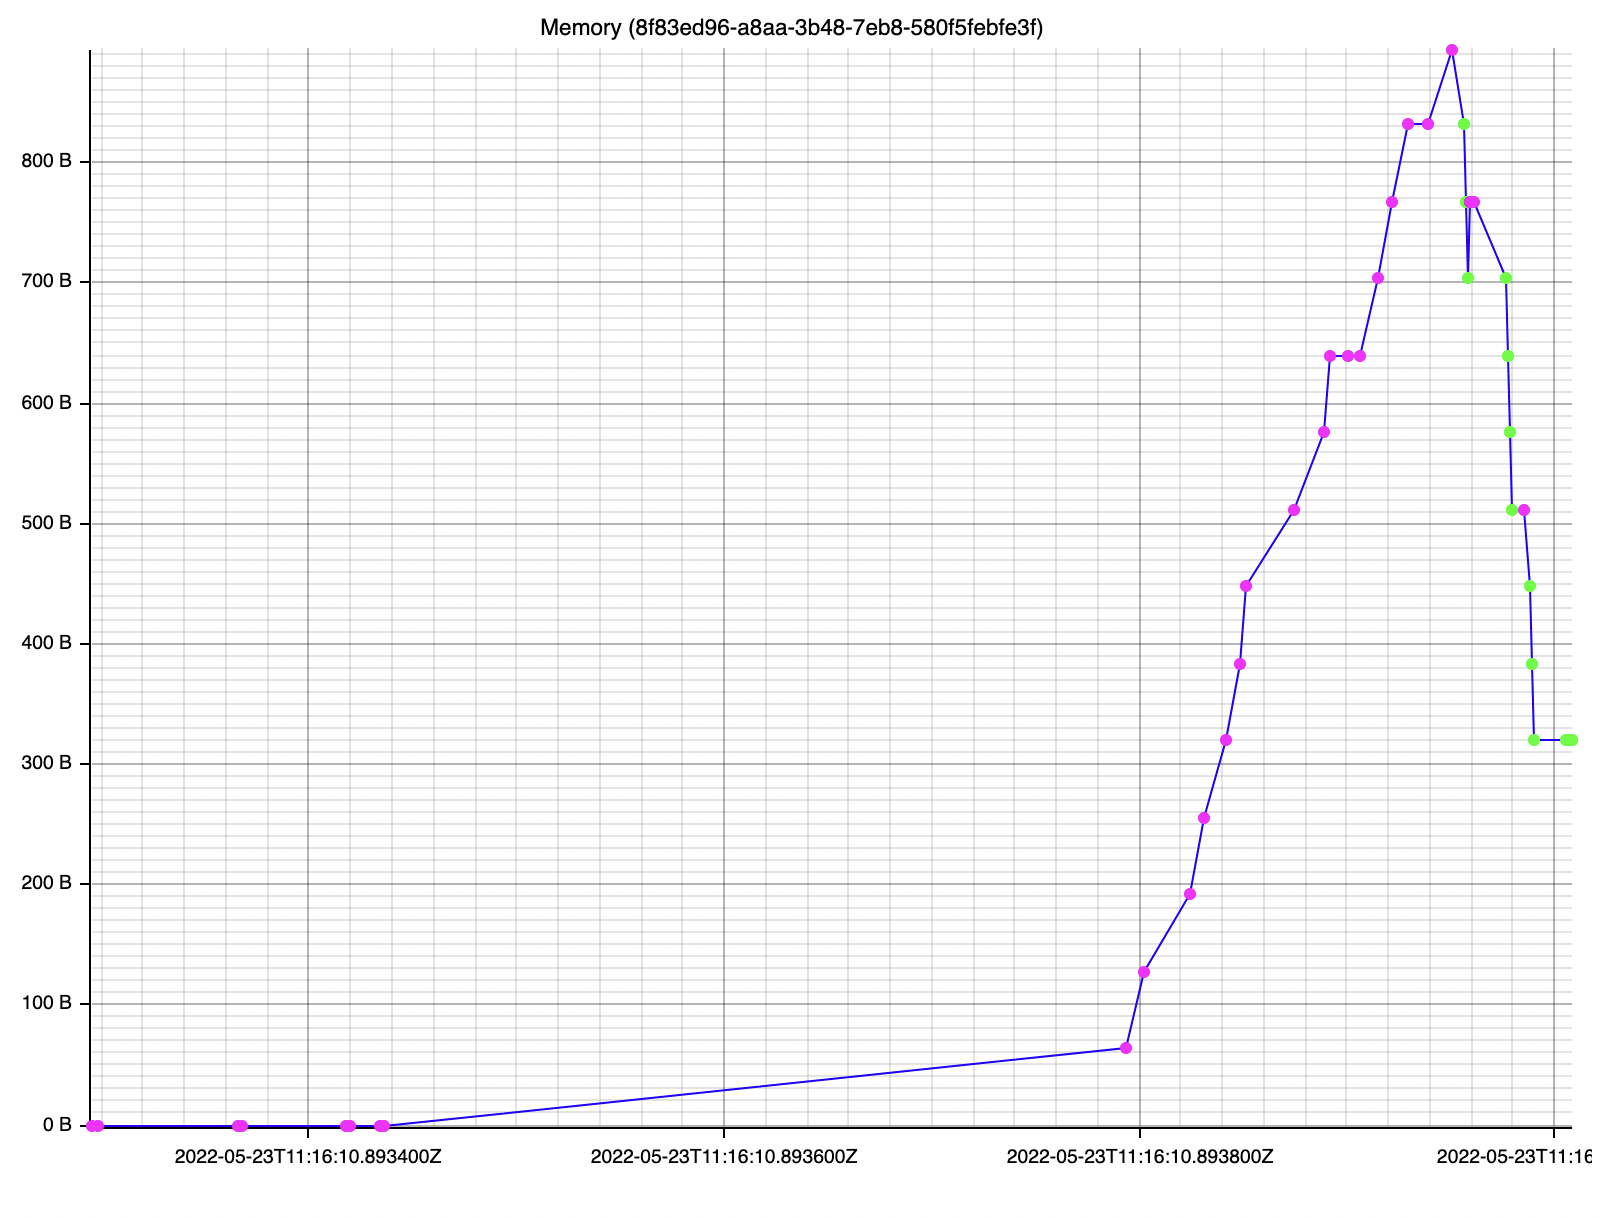
As Will pointed it out, there’s an effort to integrate OTel and Acero, and
recently I did a few experiments to collect “big allocations” as events in the
OTel traces.

I haven’t made it into a PR yet, but if you’re interested, I can brush it up a
bit and publish.

Once you have the traces, you can do all the analytics/aggregations, for
example (de)allocations) over time: IMG
<https://user-images.githubusercontent.com/5501570/171158929-b1abdf6e-f13a-4a2b-be32-bc72b643787b.png>

-Ákos

On 2022/07/06 19:42:15 Ivan Chau wrote:
> Hi all,
>
>
> My name is Ivan -- some of you may know me from some of my contributions
> benchmarking node performances on Acero. Thank you for all the help so far!
>
>
>
> In addition to my runtime benchmarking, I am interested in pursuing some
> method of memory profiling to further assess our streaming capabilities.
> I’ve taken a short look at Google Benchmarks’ memory profiling, of which I
> could really find https://github.com/google/benchmark/issues/1217, as the
> most salient example usage. It allows you to plug in your own Memory
> Manager, and specify what to return at the beginning and end of every
> benchmark.
>
>
>
> To my understanding, we would need to rework our existing memory pool /
> execution context to aggregate the number_of_allocs and bytes_used that are
> reported by Google Benchmarks, but I’d imagine there could be better tools
> for the job which might yield more interesting information (line by line
> analysis, time plots, etc., peak stats and other metrics, etc.)
>
>
>
> Do you have any advice on what direction I should take for this or know
> someone who does? I’ve run some one-off tests using valgrind but I am
> wondering if I could help implement something more general (and helpful)
> for the cpp arrow codebase.
>
>
>
> Best,
>
> Ivan
>