Memory profiling would be very helpful.  Thanks for looking into this.
A few thoughts:
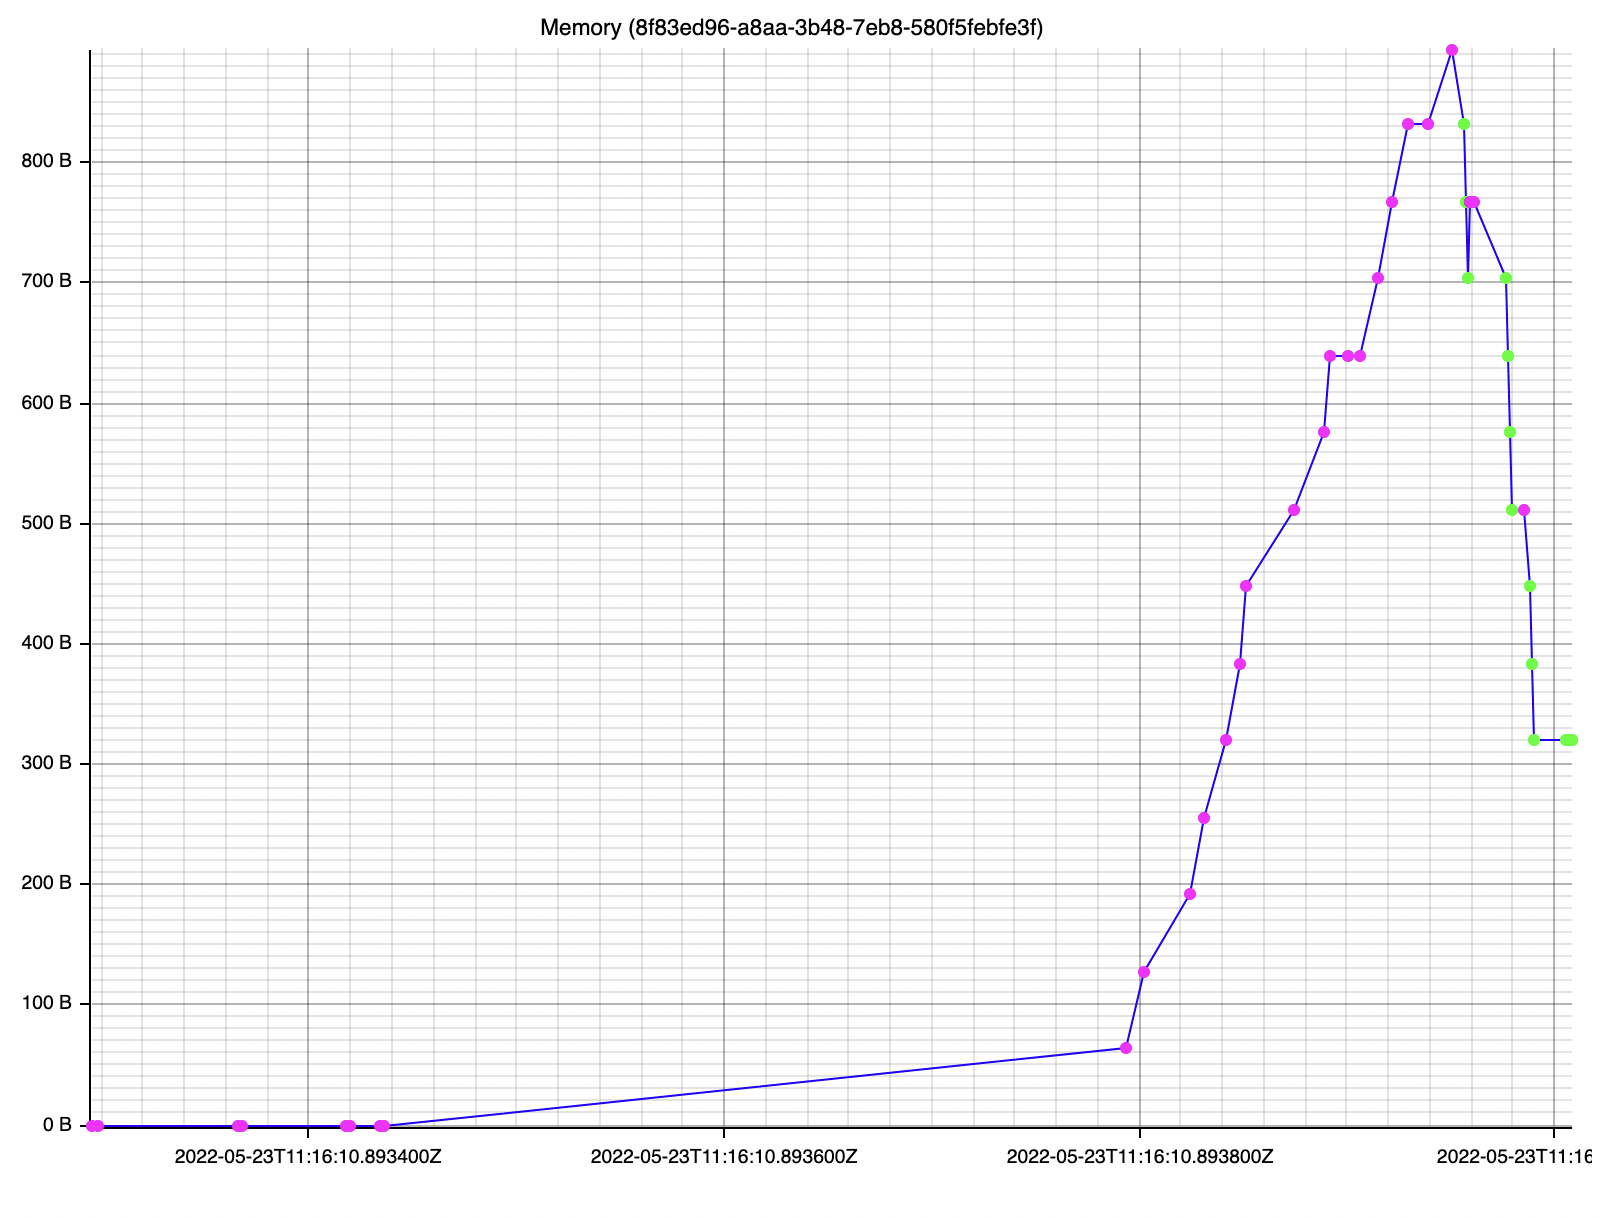
 * Peak allocation is an important number for many users.  One major
goal for Acero is to get to a point where it can constrain peak
allocation to a preconfigured amount for a single query.  We are close
but not there yet (except for certain queries).
 * In many ways I am more curious (at the moment) what results we'd
get for the small non-pool allocations.  However, I think knowing the
numbers for both sets of allocations will ultimately be useful.
Capturing the RSS of the process periodically would be useful as well
(I think we capture this last number as part of our OT metrics).
 * Allocation rate is likely important for Acero developers, although
we don't yet have any kind of "data rate" measurement either and those
two might go hand-in-hand.
 * Allocation rate & rate vs time would be useful to see for the query
as a whole.  It would also be pretty cool if there was someway to get
these numbers on a per-node basis.  That would require an individual
memory pool for each node (all proxying into a single global memory
pool) but it should be possible.  It wouldn't be possible for the
smaller allocations though.
 * If your plan has any writes then memory is likely to build up in
the form of "dirty pages that need to be written to disk but aren't
associated with the process".  I'm not sure there is anything we need
to do or should do to capture this number but it's probably useful to
know in case you see used process memory diverge from used system
memory.


On Wed, Jul 6, 2022 at 2:45 PM Rok Mihevc <[email protected]> wrote:
>
> I'm also working on exposing jemalloc statistics [1] if you'd want to
> directly access those.
>
> Rok
>
> [1] https://github.com/apache/arrow/pull/13516
>
> On Wed, Jul 6, 2022 at 11:40 PM Rok Mihevc <[email protected]> wrote:
>
> > I'm also working on exposing jemalloc statistics if you'd want to directly
> > access those.
> >
> > Rok
> >
> > On Wed, Jul 6, 2022 at 10:54 PM Ákos Hadnagy <[email protected]>
> > wrote:
> >
> >> Hi all,
> >>
> >>
> >> As Will pointed it out, there’s an effort to integrate OTel and Acero,
> >> and recently I did a few experiments to collect “big allocations” as events
> >> in the OTel traces.
> >>
> >> I haven’t made it into a PR yet, but if you’re interested, I can brush it
> >> up a bit and publish.
> >>
> >> Once you have the traces, you can do all the analytics/aggregations, for
> >> example (de)allocations) over time: IMG <
> >> https://user-images.githubusercontent.com/5501570/171158929-b1abdf6e-f13a-4a2b-be32-bc72b643787b.png
> >> >
> >>
> >> -Ákos
> >>
> >> On 2022/07/06 19:42:15 Ivan Chau wrote:
> >> > Hi all,
> >> >
> >> >
> >> > My name is Ivan -- some of you may know me from some of my contributions
> >> > benchmarking node performances on Acero. Thank you for all the help so
> >> far!
> >> >
> >> >
> >> >
> >> > In addition to my runtime benchmarking, I am interested in pursuing some
> >> > method of memory profiling to further assess our streaming capabilities.
> >> > I’ve taken a short look at Google Benchmarks’ memory profiling, of
> >> which I
> >> > could really find https://github.com/google/benchmark/issues/1217, as
> >> the
> >> > most salient example usage. It allows you to plug in your own Memory
> >> > Manager, and specify what to return at the beginning and end of every
> >> > benchmark.
> >> >
> >> >
> >> >
> >> > To my understanding, we would need to rework our existing memory pool /
> >> > execution context to aggregate the number_of_allocs and bytes_used that
> >> are
> >> > reported by Google Benchmarks, but I’d imagine there could be better
> >> tools
> >> > for the job which might yield more interesting information (line by line
> >> > analysis, time plots, etc., peak stats and other metrics, etc.)
> >> >
> >> >
> >> >
> >> > Do you have any advice on what direction I should take for this or know
> >> > someone who does? I’ve run some one-off tests using valgrind but I am
> >> > wondering if I could help implement something more general (and helpful)
> >> > for the cpp arrow codebase.
> >> >
> >> >
> >> >
> >> > Best,
> >> >
> >> > Ivan
> >> >
> >
> >