<!--
为了方便我们能够复现和修复 bug,请遵从下面的规范描述您的问题。
-->
### One-line summary [问题简述]
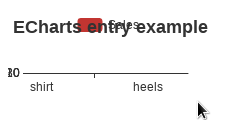
Chart collapsed when set height of chart around 120px.
### Version & Environment [版本及环境]
+ ECharts version [ECharts 版本]: 4.2.0-rc.1
+ Browser version [浏览器类型和版本]: Google Chrome Version 69.0.3497.92
+ OS Version [操作系统类型和版本]: Linux version 4.18.7-1-default
### Expected behaviour [期望结果]
The same as in tutorials.
### ECharts option [ECharts配置项]
<!-- Copy and paste your 'echarts option' here. -->
<!-- [下方贴你的option,注意不要删掉下方 ```javascript 和 尾部的 ``` 字样。最好是我们能够直接运行的
option。如何得到能运行的 option 参见上方的 guidelines for contributing] -->
```javascript
option = {
title: {
text: 'ECharts entry example'
},
tooltip: {},
legend: {
data:['Sales']
},
xAxis: {
data: ["shirt","cardign","chiffon shirt","pants","heels","socks"]
},
yAxis: {},
series: [{
name: 'Sales',
type: 'bar',
data: [5, 20, 36, 10, 10, 20]
}]
}
```
### Other comments [其他信息]
<!-- For example: Screenshot or Online demo -->
<!-- [例如,截图或线上实例 (JSFiddle/JSBin/Codepen)] -->
Using the same option as in tutorial, except for the size:
`<div id="main" style="width: 200px;height:120px;"></div>`
The result is like below:
[ Full content available at:
https://github.com/apache/incubator-echarts/issues/9084 ]
This message was relayed via gitbox.apache.org for [email protected]