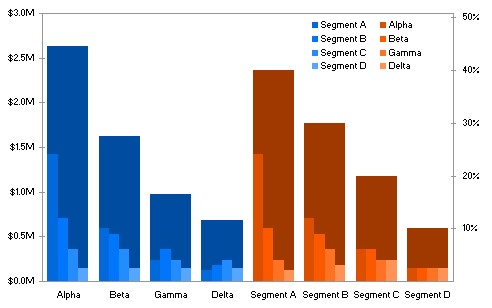
--- In [email protected], "gmoniey22" <gmonie...@...> wrote:
>
> I haven't been able to find an example of this, or any indication in the docs
> of how to do this, but I would imagine it is possible.
>
> I want to chart some data that is hierarchical. Essentially each parent has a
> few children. I want the children to be clustered columns inside a big column
> which indicates the parent (which is the sum of all the children)
>
> I found this example image which kinda shows what I am thinking of:
> http://peltiertech.com/images/2009-02/MariBar_OverlapColumns.png
>
> Thanks!
>
I'm impressed with what I've seen from  Tom Gonzalez/Axiis ... this
chart in particular:

http://www.axiis.org/examples/HClusterColumnExample.html