Hi All
The ‘some critical threshold’ for the failure of marine cloud brightening was a
CO2 concentration four times pre-industrial values.
Stephen
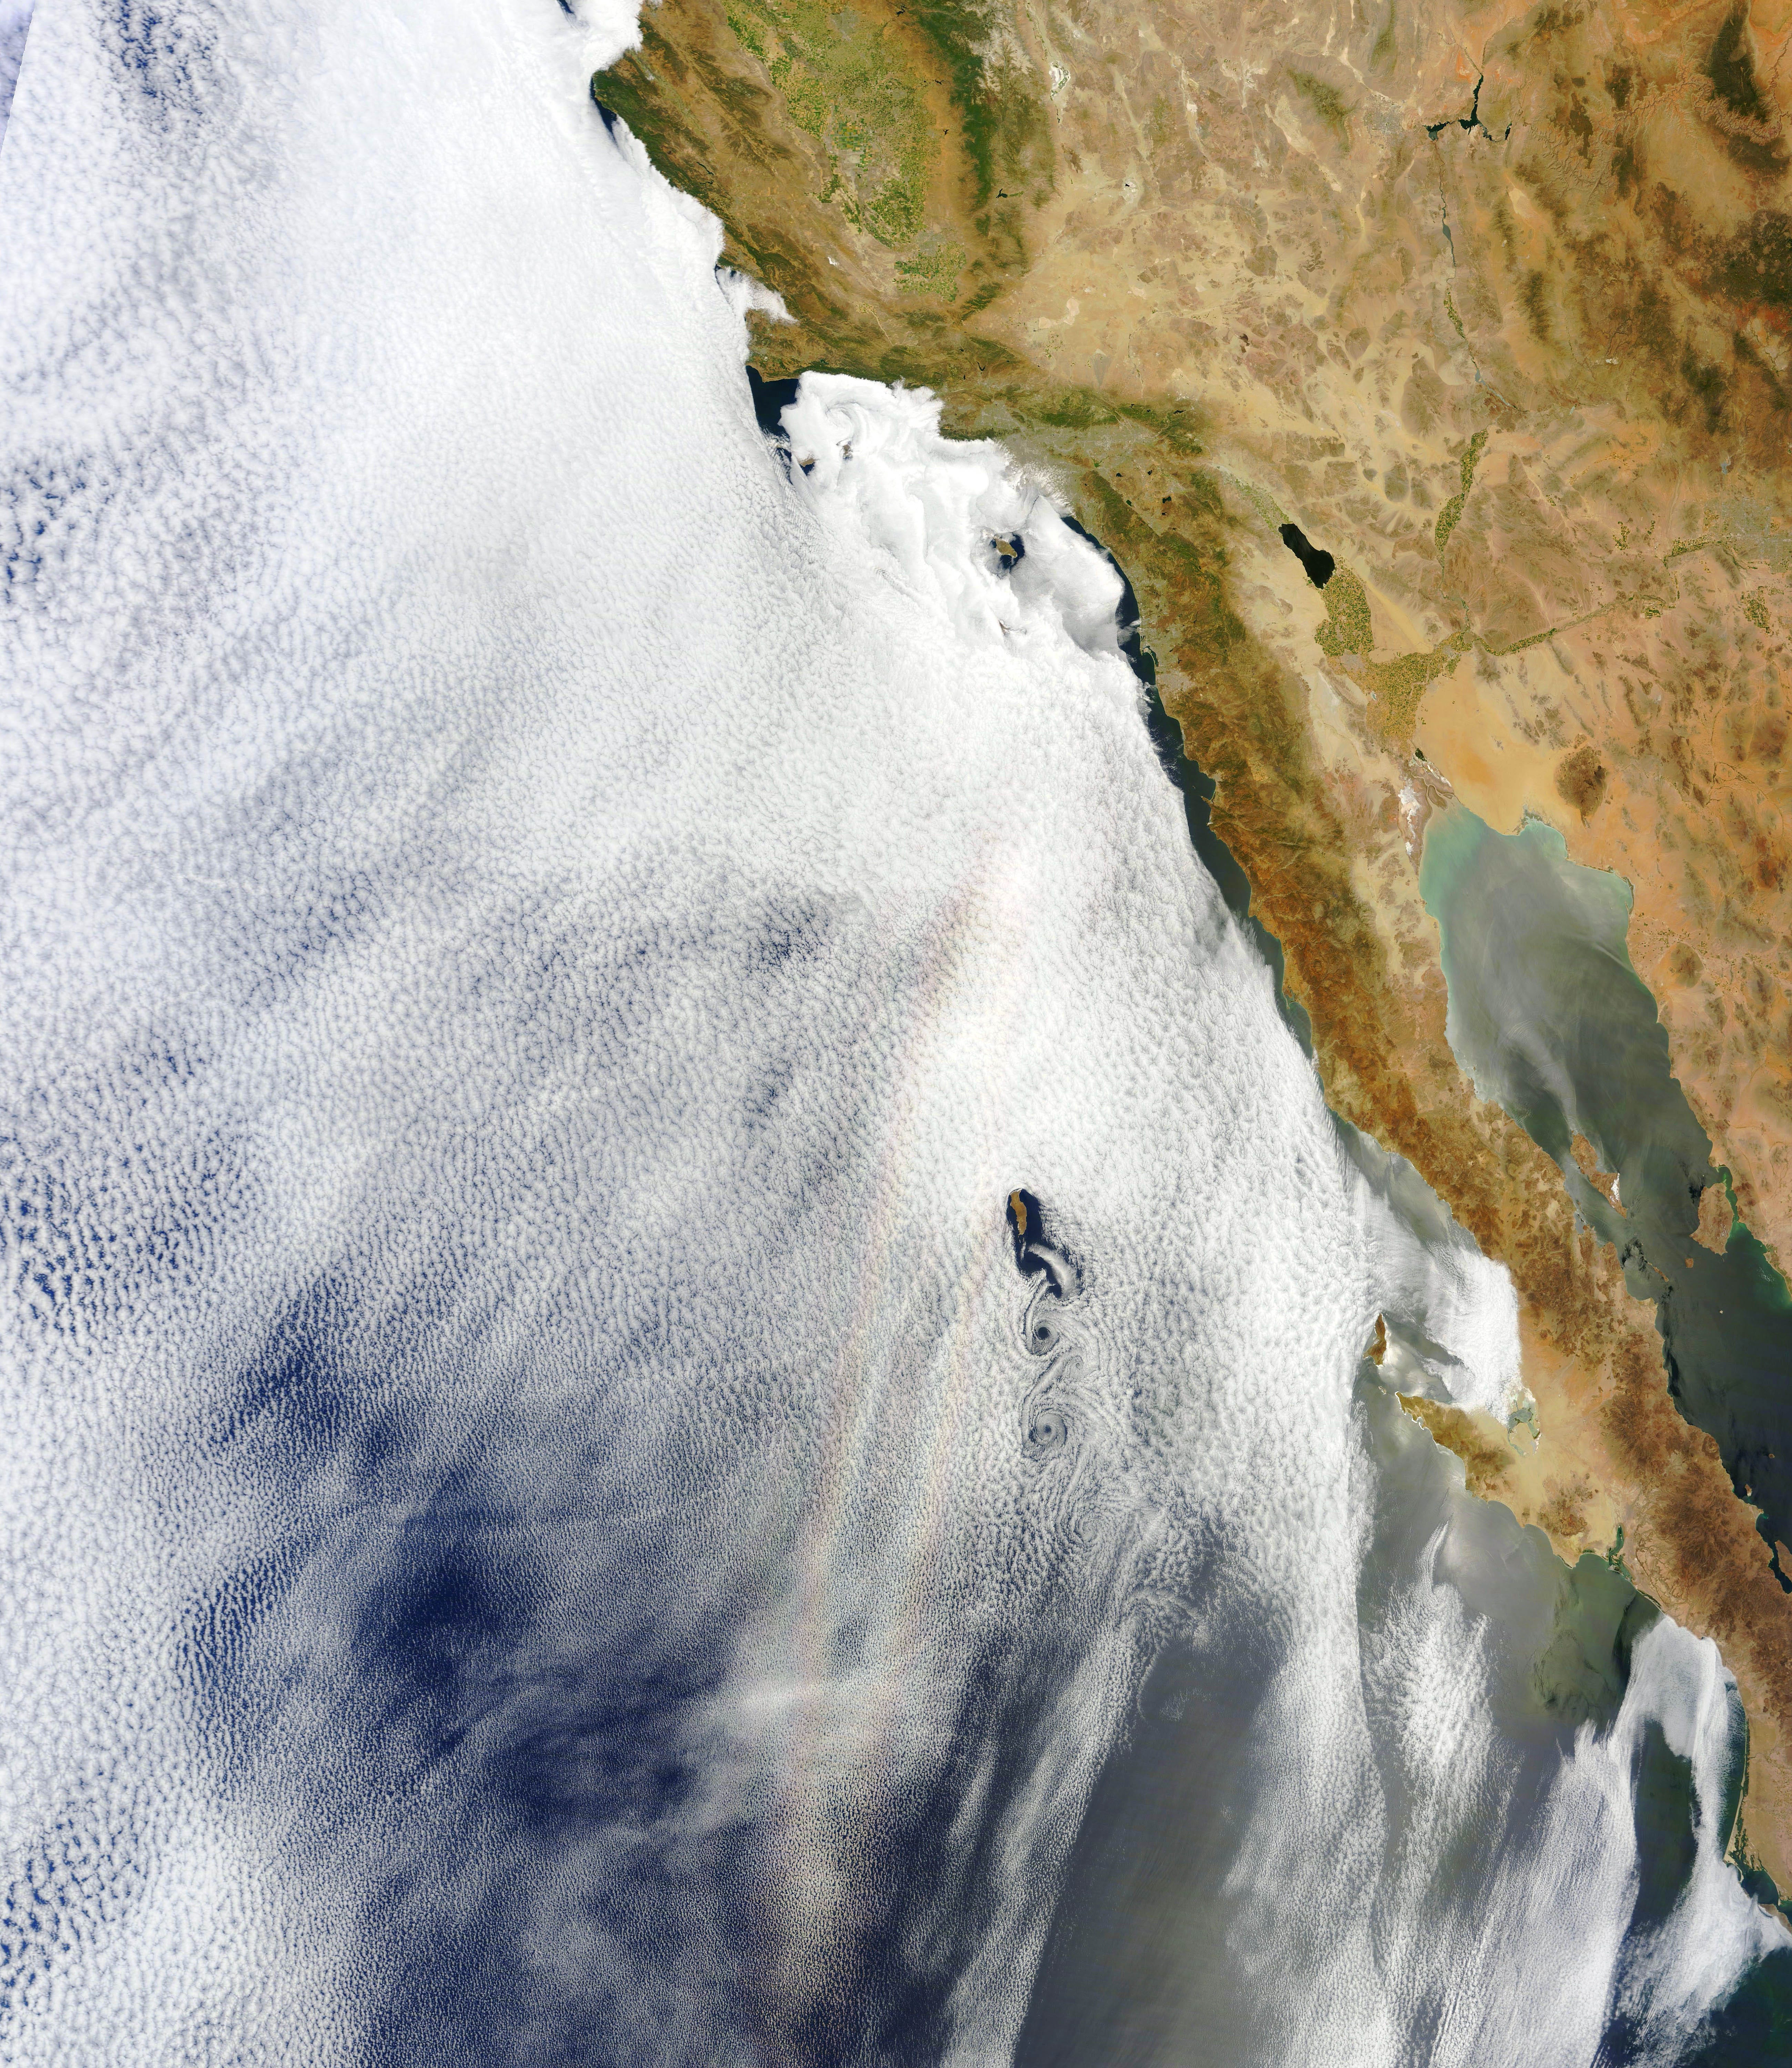
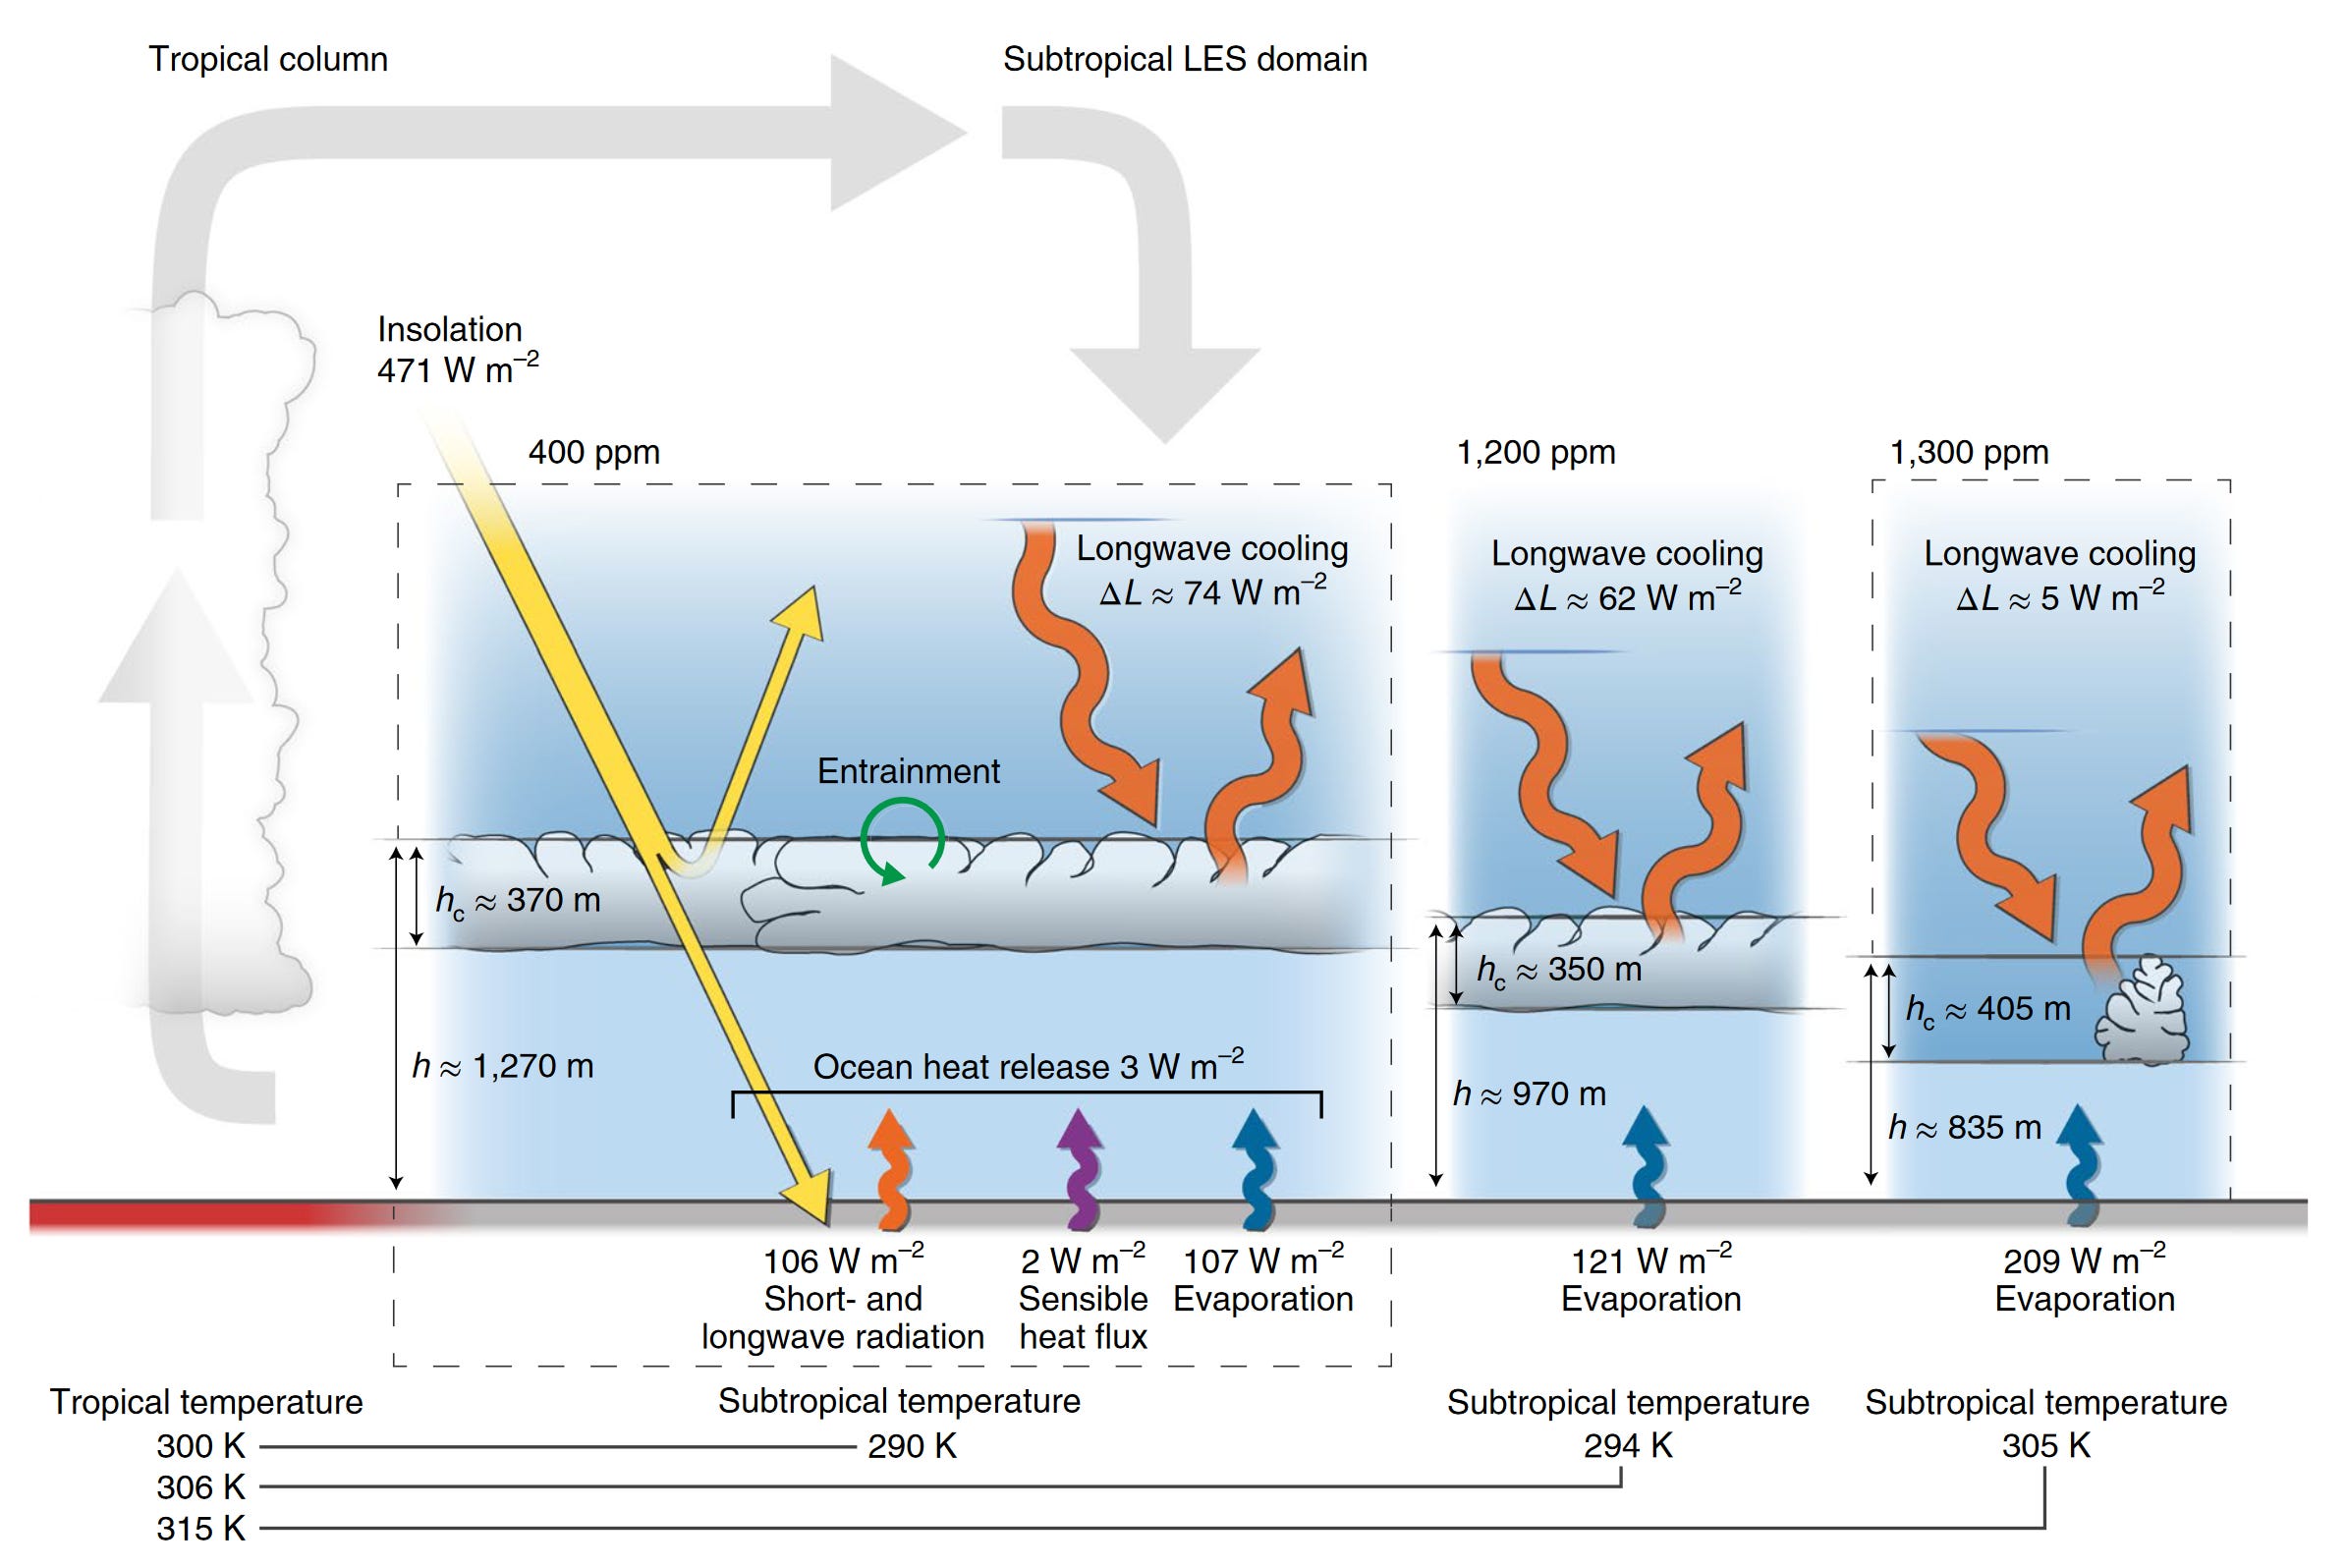
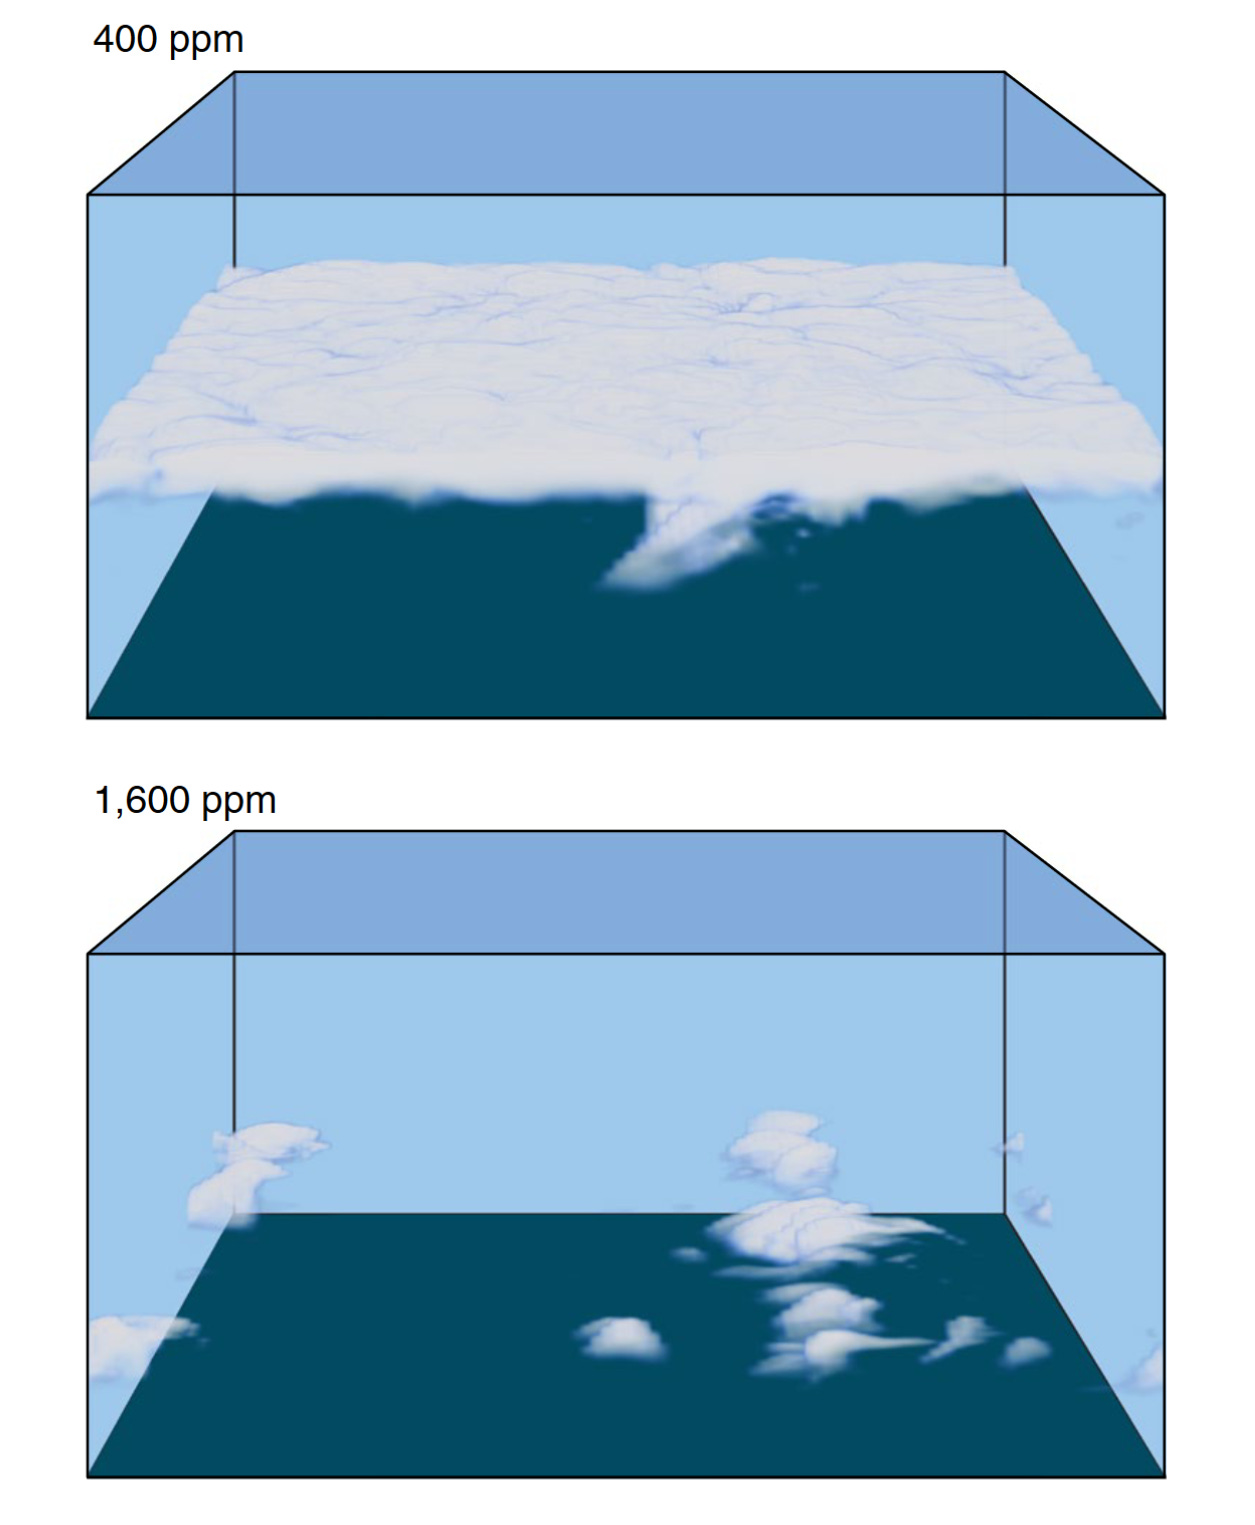
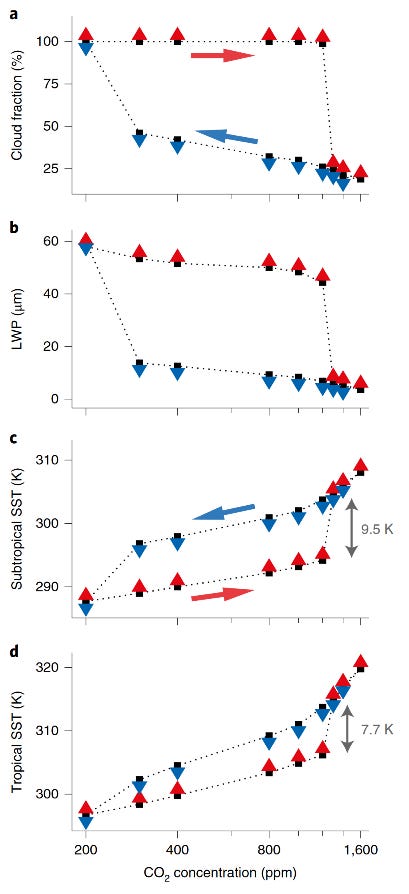
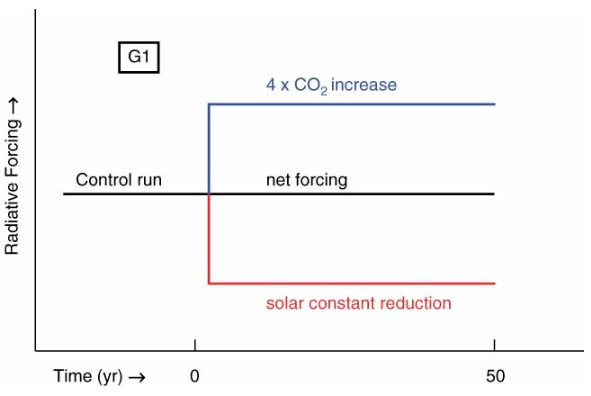
From: [email protected] <[email protected]> On
Behalf Of Geoengineering News
Sent: 16 July 2023 12:47
To: [email protected]
Subject: [geo] SRM would likely prevent the only major atmospheric tipping point

This email was sent to you by someone outside the University.
You should only click on links or attachments if you are certain that the email
is genuine and the content is safe.
https://peteirvine.substack.com/p/srm-would-likely-prevent-the-only<https://peteirvine.substack.com/p/srm-would-likely-prevent-the-only?utm_source=twitter&sd=pf>

By Pete Irvine (Plan A+)

14 July 2023

Marine stratocumulus clouds keep the Earth cool and may break-up at very high
CO2 concentrations, SRM would likely push this tipping point far beyond reach.


Marine Stratocumulus Clouds (MSCs) are low-lying clouds that cover around 20%
of the low-latitude ocean, or 6.5% of the world's surface (Figure 1). They are
highly reflective and sit over the dark oceans, and so keep the Earth much
cooler than it would otherwise be.

Worringly, Schneider et al.
(2019)<https://www.nature.com/articles/s41561-019-0310-1> found that if CO2
concentrations rose above some critical threshold there could be a sudden
transition where these Marine Stratocumulus decks break up, leading to a jump
in global temperatures of as much as 8 °C. They also found that after this
warming, CO2 concentrations would need to be brought much below the original
threshold to restore these cloud decks.

As Greenhouse Gas (GHG) forcing is a key driver of the collapse of the clouds
in their simulations, Schneider and colleagues followed up this original paper
with a study<https://www.pnas.org/doi/abs/10.1073/pnas.2003730117> testing
whether Solar Radiation Management (SRM) could prevent this. They conclude that
SRM “is not a fail-safe option to prevent global warming because it does not
mitigate risks to the climate system that arise from direct effects of
greenhouse gases on cloud cover.”

As I pointed out in my last
post<https://peteirvine.substack.com/publish/post/128960895> they focus
strongly on the fact that it fails to prevent this tipping point while
neglecting to note that it substantially raises the threshold CO2 level where
it occurs. Here, I want to dig a bit deeper and explain how their study also
substantially under-estimates the potential of SRM to prevent this potentially
catastrophic tipping point.
<https://substackcdn.com/image/fetch/f_auto,q_auto:good,fl_progressive:steep/https%3A%2F%2Fsubstack-post-media.s3.amazonaws.com%2Fpublic%2Fimages%2F2e5f095f-2f82-4936-9669-2e7fde0191a7_5200x6000.jpeg>
[Marine stratocumulus -
Wikipedia]<https://substackcdn.com/image/fetch/f_auto,q_auto:good,fl_progressive:steep/https%3A%2F%2Fsubstack-post-media.s3.amazonaws.com%2Fpublic%2Fimages%2F2e5f095f-2f82-4936-9669-2e7fde0191a7_5200x6000.jpeg>


Figure 1. Marine Stratocumulus clouds off the coast of Baja California. Source:
Wiki<https://en.wikipedia.org/wiki/Marine_stratocumulus>

How Marine Stratocumulus Clouds work

Most clouds form when surface warming produces warm, moist, buoyant air parcels
which rise high enough that the water vapour condenses to form water droplets.
For Marine stratocumulus clouds this convection process is driven instead from
the top-down, rather than the bottom-up.

Marine stratocumulus clouds are low clouds that form in the sub-tropics, i.e.,
desert-like regions where there are no high clouds and warm, dry air descends
from above. Dry air isn’t good at absorbing thermal radiation and keeping the
surface warm, which is why deserts can see temperatures drop from scorching in
the day time to frigid at night.

This means that the top of marine stratocumulus clouds lose lots of energy by
emitting thermal radiation to space (radiative cooling). This cloud-top
radiative cooling leads to cool, dense air parcels dropping to the surface,
driving up warm, moist air from the surface in return. Rather than the surface
warming that drives convection in most other clouds, radiative cooling drives
the convection that sustains marine stratocumulus clouds (See Figure 2, left).

Marine Stratocumulus Clouds break up when either the radiative cooling becomes
too weak to drive air parcels all the way to the surface, breaking their
connection with their moisture source (the ocean), or when too much warm, dry
air is mixed in from above the cloud-top as this dries out the clouds making
them less good at radiatively cooling themselves.
<https://substackcdn.com/image/fetch/f_auto,q_auto:good,fl_progressive:steep/https%3A%2F%2Fsubstack-post-media.s3.amazonaws.com%2Fpublic%2Fimages%2F248144e6-d3b6-4edc-842d-18b16aa5872f_2389x1596.png>
[https://substackcdn.com/image/fetch/w_1456,c_limit,f_auto,q_auto:good,fl_progressive:steep/https%3A%2F%2Fsubstack-post-media.s3.amazonaws.com%2Fpublic%2Fimages%2F248144e6-d3b6-4edc-842d-18b16aa5872f_2389x1596.png]<https://substackcdn.com/image/fetch/f_auto,q_auto:good,fl_progressive:steep/https%3A%2F%2Fsubstack-post-media.s3.amazonaws.com%2Fpublic%2Fimages%2F248144e6-d3b6-4edc-842d-18b16aa5872f_2389x1596.png>


Figure 2. Figure 1 from Schneider et al.
(2019)<https://www.nature.com/articles/s41561-019-0310-1>, full caption in
footnote
1
. Shows the energy budget of marine stratocumulus clouds at different CO2
concentrations, for today’s conditions (400 ppm), and just before (1200 ppm)
and just after (1300 ppm) the break-up of the cloud-deck.
Modeling Marine Stratocumulus Clouds (is hard)

The processes which drive cloud formation occur at a scale of 10s of metres,
far below the scales captured in global climate models (~10 km in the latest,
most expensive models, and more like ~100 km in more standard climate models).
This means that key cloud processes are “parameterized” in climate models,
i.e., they are not directly simulated and instead relatively simple equations
are used which aim to capture the larger-scale behaviour of clouds seen in
observations or other types of models.

Schneider et al. use what’s known as a Large Eddy Simulation (LES) Model, or
Cloud-Resolving Model in their study which simulates a patch of clouds a few km
across but at a very high resolution of 50m horizontally and 10m vertically.
This allows them to directly simulate the processes involved in the formation
and break-up of clouds (see Figure 2).

Normally these models fix sea-surface temperatures and so cannot simulate
global warming or local feedbacks from ocean warming, but Schneider et al.
apply a trick to get around this. They couple their cloud-resolving model,
which represents the marine stratocumulus decks, to a simple 1-D model of the
Tropical atmosphere, which can estimate the global temperature response and
changes to the atmospheric column.

This approach lets them estimate the effects of changes in the marine
stratocumulus decks on tropical and global temperatures, and to feed back these
changes onto their patch of marine stratocumulus clouds. It’s crude, but it
allows them to demonstrate this potential novel tipping point in cloud dynamics
and its global implications.
<https://substackcdn.com/image/fetch/f_auto,q_auto:good,fl_progressive:steep/https%3A%2F%2Fsubstack-post-media.s3.amazonaws.com%2Fpublic%2Fimages%2F812e1897-48a8-4b52-9843-1462460eba28_1255x1525.png>
[https://substackcdn.com/image/fetch/w_1456,c_limit,f_auto,q_auto:good,fl_progressive:steep/https%3A%2F%2Fsubstack-post-media.s3.amazonaws.com%2Fpublic%2Fimages%2F812e1897-48a8-4b52-9843-1462460eba28_1255x1525.png]<https://substackcdn.com/image/fetch/f_auto,q_auto:good,fl_progressive:steep/https%3A%2F%2Fsubstack-post-media.s3.amazonaws.com%2Fpublic%2Fimages%2F812e1897-48a8-4b52-9843-1462460eba28_1255x1525.png>


Figure 3. Figure 2 from Schneider et al. (2019), showing the stratocumulus
decks at 400 ppm and at 1600 ppm, i.e., after they have broken down.

A major, new tipping point

A “tipping point” is a metaphor for the phenomenon that beyond a certain
threshold, a runaway process, or positive feedback, pushes a system into some
new state. Think of pushing your coffee cup along the table. Things proceed
smoothly up to a point, but once it goes over the edge, pushing it the other
way will not get it back where it started.

Several tipping points have been identified in the Earth System, such as the
collapse of the Greenland Ice Sheet and the shut down of the Atlantic
Meridional Overturning Circulation (partly responsible for the gulf stream that
brings warm waters to Europe). These examples both exhibit “hysteresis”: Once
the system is pushed beyond a certain point, pushing it back the other way
might not bring it back and you may need to push it much further to let it
recover.

Schneider et al. (2019)<https://www.nature.com/articles/s41561-019-0310-1> find
for the first time an atmospheric process that might lead to a global tipping
point with hysteresis (Figure 3). They show that as the CO2 concentration
increases (red) things warm (c, d) and the clouds thin (b) up to a point and
then there’s a sudden collapse of cloud cover (d) at 1300 parts per million
(ppm, >3x today’s CO2 concentration) and an enormous jump in temperatures of ~8
°C. Then when they dial back the CO2 concentrations in this warmer world cloud
cover stays low, only returning to their original levels when CO2 gets to 200
ppm (0.5x today’s CO2 concentration).
<https://substackcdn.com/image/fetch/f_auto,q_auto:good,fl_progressive:steep/https%3A%2F%2Fsubstack-post-media.s3.amazonaws.com%2Fpublic%2Fimages%2F357434e9-948e-4a02-a0df-63ea93fbefb0_409x894.png>
[https://substackcdn.com/image/fetch/w_1456,c_limit,f_auto,q_auto:good,fl_progressive:steep/https%3A%2F%2Fsubstack-post-media.s3.amazonaws.com%2Fpublic%2Fimages%2F357434e9-948e-4a02-a0df-63ea93fbefb0_409x894.png]<https://substackcdn.com/image/fetch/f_auto,q_auto:good,fl_progressive:steep/https%3A%2F%2Fsubstack-post-media.s3.amazonaws.com%2Fpublic%2Fimages%2F357434e9-948e-4a02-a0df-63ea93fbefb0_409x894.png>


Figure 4. Figure 3 from Schneider et al. (2019), showing stratocumulus
instability and hysteresis with fixed large-scale subsidence. Subtropical cloud
fraction (a). Cloud liquid water path (LWP, b). Subtropical sea surface
temperature (SST, c) and Tropical SST (d). Full caption in footnote
2
.

While other tipping points in the Earth system can have substantial regional
impacts and modest impacts on global temperatures, Schneider et al. find that
their tipping point more than doubled global temperature change in their
simulations!

Now this would be truly catastrophic, but its worth noting that even if they
are right 1300 ppm is a long way away from where we are today and where we’re
likely to go in the future. And, as I’ll explain SRM would likely push this
threshold far beyond reach.

Mechanisms behind marine stratocumulus break-up

Let’s dig in a bit deeper and understand why this happens (sorry, it’s going to
get a little technical here). Schneider et al. identify 2 interacting
mechanisms that are responsible for the break-up of marine stratocumulus decks
under high-CO2 conditions.

1.      The elevated CO2 concentrations make the atmosphere more opaque to
thermal radiation, leading it to emit more thermal radiation down towards the
cloud top and reducing their ability to cool by radiating heat. As the
convection in these clouds is driven by radiative cooling, this weakens the
convection that couples the clouds to the ocean surface, eventually decoupling
them from their moisture source and leading them to break up.

2.      Warmer sea-surface temperatures lead to more evaporation at the
surface. This leads to a greater transport of moist heat energy to the cloud
top which leads to more intense mixing when this moisture condenses. This
intensified mixing draws in more warm, dry subtropical air from above which
dries the cloud making it less effective at radiating heat, contributing to the
weakening of convection.

They combine these meachanisms and cloud adjustments in a simple conceptual
model to define an instability parameter (S) to predict the break-up of
stratocumulus decks. Their equation is:

Equation 1. S = (LHF/ΔL) × (hc/h)

Where LHF is the latent heat flux from the surface, ΔL is the radiative cooling
of the cloud tops, hc is the thickness of the cloud layer and h is the
cloud-top height (See Figure 2). They find that when the instability parameter,
S, exceeds a critical threshold of ~0.6 the cloud layer breaks up.

SRM fails to be perfect, but greatly reduces the risk

In their follow-up paper, Schneider et al.
(2020)<https://www.pnas.org/doi/abs/10.1073/pnas.2003730117>, the authors
demonstrate that SRM fails to eliminate this risk. This seems reasonable as the
insulating effects of CO2 suppress the radiative cooling which is essential to
these clouds. However, issues with their experimental design leads them to
grossly underestimate the potential of SRM to reduce the threat from this
tipping point.

They represent SRM as a simple reduction in incoming sunlight and find that SRM
fails to eliminte the risk of marine stratocumulus break-up, but it pushes the
critical CO2 level up from >1200 ppm (>3x today’s CO2) to >1700 ppm (>4.25x
today’s CO2), and reduces the magnitude of the increase in global temperatures
from ~8 to ~5 °C. They also find that the hysteresis (the stickiness of this
new cloudless state) is still present and CO2 concentrations still need to be
brought way down for the marine stratocumulus clouds to recover.

In their write-up, the authors focus on the failure of SRM to eliminate the
risk, while neglecting to make obvious comparisons to their original study
which show that SRM raises this critical threshold. Here’s their claim from the
plain language summary:

“we demonstrate that solar geoengineering is not a fail-safe option to prevent
global warming because it does not mitigate risks to the climate system that
arise from direct effects of greenhouse gases on cloud cover.”

The dictionary definition of “Mitigate” is “to reduce the severity of
something”, and they found that it both reduced the magnitude of the additional
warming and raised the threshold CO2 level needed to cause this tipping point.
This plain language summary therefore gives a clearly misleading impression
that SRM fails as noted in Reynolds
(2022)<https://journals.sagepub.com/doi/full/10.1177/20530196221095569> and my
last
post<https://peteirvine.substack.com/p/are-srm-scientists-boosters-or-blockers>.

Underestimating the potential of SRM

Not only did Schneider et
al.<https://www.pnas.org/doi/abs/10.1073/pnas.2003730117> mischaracterize their
own findings, they also badly misrepresented SRM in their experiments and so
substantially underestimated its potential to reduce the risk of this tipping
point. Let me explain.

It seems that they were trying to replicate the kind of experimental design
seen in the Geoengineering Model Intercomparison Project’s (GeoMIP) idealized
G1 experiment (Figure 5) where a large increase in CO2 is offset by an
equivalent reduction in incoming sunlight to keep temperatures constant. Here,
they apply a 3.7 Wm-2 reduction in incoming sunlight for every doubling of CO2
which seems reasonable at first glance, as it’s equal to the global radiative
forcing from a doubling of CO2. However, this substantially underestimates the
reduction in sunlight needed for a number of reasons. First, ~30% of all
incoming light is reflected to space, second, the tropics and subtropics (which
they simulate) receive more sunlight than the global average, and third,
reducing incoming sunlight produces cloud feedbacks that can partially offset
the reduction.
<https://substackcdn.com/image/fetch/f_auto,q_auto:good,fl_progressive:steep/https%3A%2F%2Fsubstack-post-media.s3.amazonaws.com%2Fpublic%2Fimages%2Fbbee37d4-41af-4486-be0c-1da90dcead47_591x396.png>
[https://substackcdn.com/image/fetch/w_1456,c_limit,f_auto,q_auto:good,fl_progressive:steep/https%3A%2F%2Fsubstack-post-media.s3.amazonaws.com%2Fpublic%2Fimages%2Fbbee37d4-41af-4486-be0c-1da90dcead47_591x396.png]<https://substackcdn.com/image/fetch/f_auto,q_auto:good,fl_progressive:steep/https%3A%2F%2Fsubstack-post-media.s3.amazonaws.com%2Fpublic%2Fimages%2Fbbee37d4-41af-4486-be0c-1da90dcead47_591x396.png>


Figure 5. Schematic of experiment G1. The experiment is started from a control
run. The instantaneous quadrupling of CO2 concentration from pre-industrial
levels is balanced by a reduction in the solar constant until year 50. Figure 1
from Kravitz et al.
(2011)<https://rmets.onlinelibrary.wiley.com/doi/full/10.1002/asl.316>.

In the GeoMIP G1
experiment<https://agupubs.onlinelibrary.wiley.com/doi/full/10.1002/jgrd.50646>
the models needed to reduce incoming sunlight by between 1.75% and 2.5% for
every doubling of CO2 to offset all warming. If we take the middle of that
range, 2.25%, and multiply it by the insolation in their cloud resolving model
(471 Wm-2) we find that they should have reduced incoming sunlight by 10.6 Wm-2
for every doubling of CO2 rather than 3.7 Wm-2 if they wanted to represent SRM
deployed to keep temperatures constant. Unsurprisingly, they fail to keep
temperatures constant as they ramp up their CO2 concentrations, only offsetting
roughly half of the warming as compared to their CO2-only runs.

At the point just before the break-up of the marine stratocumulus clouds in
their standard simulations (1200 ppm CO2), ~50% of the reduction in radiative
cooling comes not from CO2 forcing but from the elevated water vapour content
that comes from warming. As SRM has offset half of the warming in their new
runs, they reason that it has therefore halved this water vapour contribution,
and they suggest this means that it only contributes ~25%, but this is
incorrect. If CO2 contributed 2 units and warming contributed a further 2
units, halving the warming would mean that it contributed 1/3 of the new total.
This means that by failing to eliminate the warming they have overestimated the
reduction in radiative cooling that would be seen in a fully-offsetting
deployment of SRM by ~50%. In their SRM simulations radiative cooling has been
reduced by 22%, which suggests that if warming had been eliminated it would
only have fallen by ~14.5%.

This residual warming also contributes to the increased evaporation and latent
heat flux from the surface, another source of instability (Equation 1). They
find that the latent heat flux is ~17% stronger in their SRM simulations just
before the break-up due to this warming. However, if they’d been successful in
offsetting all warming with SRM then we might instead expect a reduction, or at
most no change, in evaporation and latent heat flux as seen in the GeoMIP G1
simulations (Kravitz et al.
2013<https://agupubs.onlinelibrary.wiley.com/doi/full/10.1002/jgrd.50646>,
Figure 3).

According to my very rough calculations
3
, if they had eliminated the warming in their SRM simulations, rather than only
halving it, they would have found that they needed to double CO2 concentrations
again to produce marine stratocumulus break-up in their SRM simulations. If I’m
right, then rather than SRM increasing the critical threshold by 500 pppm from
>1200 to >1700 ppm as they suggest, it would have increased it by 2200 ppm,
from >1200 to something more like >3400 ppm.
More research needed

Schneider et al.’s 2019
paper<https://www.nature.com/articles/s41561-019-0310-1> was a groundbreaking
piece of work, highlighting a novel potential mechanism that could lead to a
tipping point in marine stratocumulus and dramatic warming under high CO2
conditions. While another idealized
study<https://journals.ametsoc.org/view/journals/clim/36/8/JCLI-D-22-0528.1.xml>
 has reproduced their findings, much more work is needed on this issue.

Their 2020 paper<https://www.pnas.org/doi/abs/10.1073/pnas.2003730117> was a
neat extension of their work, but it misrepresented SRM in such a way that they
grossly underestimated the potential of SRM to address this potential tipping
point. They also mischaracterised their own findings to promote a message that
SRM “fails to mitigate” when in fact they showed that it would greatly
increased the CO2 threshold from extremely high (>1200 ppm) to implausibly high
concentrations (>1700 ppm) and reduce the temperature increase substantially.
If they’d simulated SRM correctly (and my rough calculations are correct),
they’d likely have shown that it would have raised the threshold from
implausibly high to impossibly high levels (>3400 ppm)
4
.

If the marine stratocumulus collapse theory is borne out in future simulations,
and Schneider et al.’s simple conceptual model holds up, then I’m confident
that future studies of SRM’s potential to address this threat will show that it
is far more effective than Schneider et al.
2020<https://www.pnas.org/doi/abs/10.1073/pnas.2003730117> suggest.

FIN


1<https://peteirvine.substack.com/p/srm-would-likely-prevent-the-only?utm_source=twitter&sd=pf#footnote-anchor-1-134568089>

Fig. 1 | Simulated subtropical clouds in the present climate (400 ppm Co2), at
higher Co2 (1,200 ppm) and after stratocumulus breakup (1,300 ppm). In
stratocumulus clouds, longwave radiative cooling of the cloud tops propels air
parcels downward, which convectively connects the clouds to their moisture
supply at the surface. Turbulence entrains warm and dry air across the
inversion, which counteracts the radiative cooling and convective moistening of
the cloud layer. When the atmospheric concentration of greenhouse gases (for
example, CO2 and H2O) increases (1,200 ppm), the longwave cooling of the cloud
tops weakens, because the downwelling longwave radiation that reaches the cloud
tops from above emanates at lower levels with higher temperatures relative to
the cloud-top temperatures. Eventually, at sufficiently high greenhouse gas
concentrations (1,300 ppm in our simulation without subsidence changes),
stratocumulus decks break up into cumulus clouds, which leads to dramatic
surface warming. Evaporation then strengthens, and the average longwave cooling
at the level of the cloud tops drops to less than 10% of its value in the
presence of stratocumulus decks.
2<https://peteirvine.substack.com/p/srm-would-likely-prevent-the-only?utm_source=twitter&sd=pf#footnote-anchor-2-134568089>

Fig. 3 | Stratocumulus instability and hysteresis with fixed large-scale
subsidence. a, Subtropical cloud fraction. b, Cloud liquid water path (LWP). c,
Subtropical SST. d, Tropical SST. Red upward arrows indicate the simulations
that started from the baseline simulation with 400 ppm CO2; blue downward
arrows indicate the simulations that started from 1,600 ppm. The CO2 axis is
logarithmic (ticks every 200 ppm) because the radiative forcing of CO2 is
logarithmic in concentration. Departures of the SST changes from straight lines
indicate the degree to which the climate sensitivity is state dependent. Higher
climate sensitivities at high CO2, after stratocumulus breakup, occur because
the tropical column is approaching a local runaway greenhouse state25.
3<https://peteirvine.substack.com/p/srm-would-likely-prevent-the-only?utm_source=twitter&sd=pf#footnote-anchor-3-134568089>

Looking back to Equation 1, we can make a rough estimate of how much higher CO2
concentrations would need to rise to reach the critical threshold if the full
warming had been offset by SRM. The key term is (LHF/ΔL) and at the critical
threshold (1700 ppm) in their simulations, LHF is 17% higher and ΔL is 22%
lower than in the baseline simulation (400 ppm), meaning that we have a 33%
increase in this term, (1.17/0.78)*(LHF_400/ΔL_400). As the radiative forcing
from CO2 increases is logarithmic, a little over 2 doublings of the CO2
concentration had produced a 33% increase in this term. If we recalculate the
change in that term for a no warming case where we assume there is no change in
latent heat flux, and a radiative cooling that is only 2/3 of the original, we
get a change in this term of only 17%. To get this back up to ~33% we would
need to double the CO2 forcing again, from >4 times today’s level to >8 times
today’s level, i.e. >3200 ppm.
4<https://peteirvine.substack.com/p/srm-would-likely-prevent-the-only?utm_source=twitter&sd=pf#footnote-anchor-4-134568089>

The most extreme emissions scenario considered by the IPCC, the implausible
SSP5-8.5 scenario which sees global coal consumption in 2100 that is 5x higher
than
today’s<https://www.carbonbrief.org/explainer-the-high-emissions-rcp8-5-global-warming-scenario/>,
 doesn’t reach 1200 ppm until around the end of the 21st century, 1700 ppm in
the 2nd half of the 22nd century, and never gets close to 3200 ppm.


Source: Substack


--
You received this message because you are subscribed to the Google Groups
"geoengineering" group.
To unsubscribe from this group and stop receiving emails from it, send an email
to
[email protected]<mailto:[email protected]>.
To view this discussion on the web visit
https://groups.google.com/d/msgid/geoengineering/CAHJsh9-LHjspCzD1RxCiObehkJCpqAnhii_KvLoATcnGL13g8g%40mail.gmail.com<https://groups.google.com/d/msgid/geoengineering/CAHJsh9-LHjspCzD1RxCiObehkJCpqAnhii_KvLoATcnGL13g8g%40mail.gmail.com?utm_medium=email&utm_source=footer>.
The University of Edinburgh is a charitable body, registered in Scotland, with
registration number SC005336. Is e buidheann carthannais a th’ ann an Oilthigh
Dhùn Èideann, clàraichte an Alba, àireamh clàraidh SC005336.

--
You received this message because you are subscribed to the Google Groups
"geoengineering" group.
To unsubscribe from this group and stop receiving emails from it, send an email
to [email protected].
To view this discussion on the web visit
https://groups.google.com/d/msgid/geoengineering/PAXPR05MB8048FAAB6BC35CE7DDDE6696A73AA%40PAXPR05MB8048.eurprd05.prod.outlook.com.