Hi Justin,
Since it is somewhat similar, I wanted to share how GeoMesa creates
heatmaps using GeoServer. We have a small WPS which riffs on the
HeatMapProcess (1). That process is called via an SLD. By doing that,
we can have a regular vector layer, but then generate heatmaps for it
without fiddling with a second coverage, etc.
Potentially, an approach like that could line up more of the rendering
pipeline to achieve blur, etc.
Cheers,

Jim
1.
https://github.com/geotools/geotools/blob/master/modules/unsupported/process-feature/src/main/java/org/geotools/process/vector/HeatmapProcess.java
On 04/06/2016 04:02 PM, Justin Deoliveira wrote:
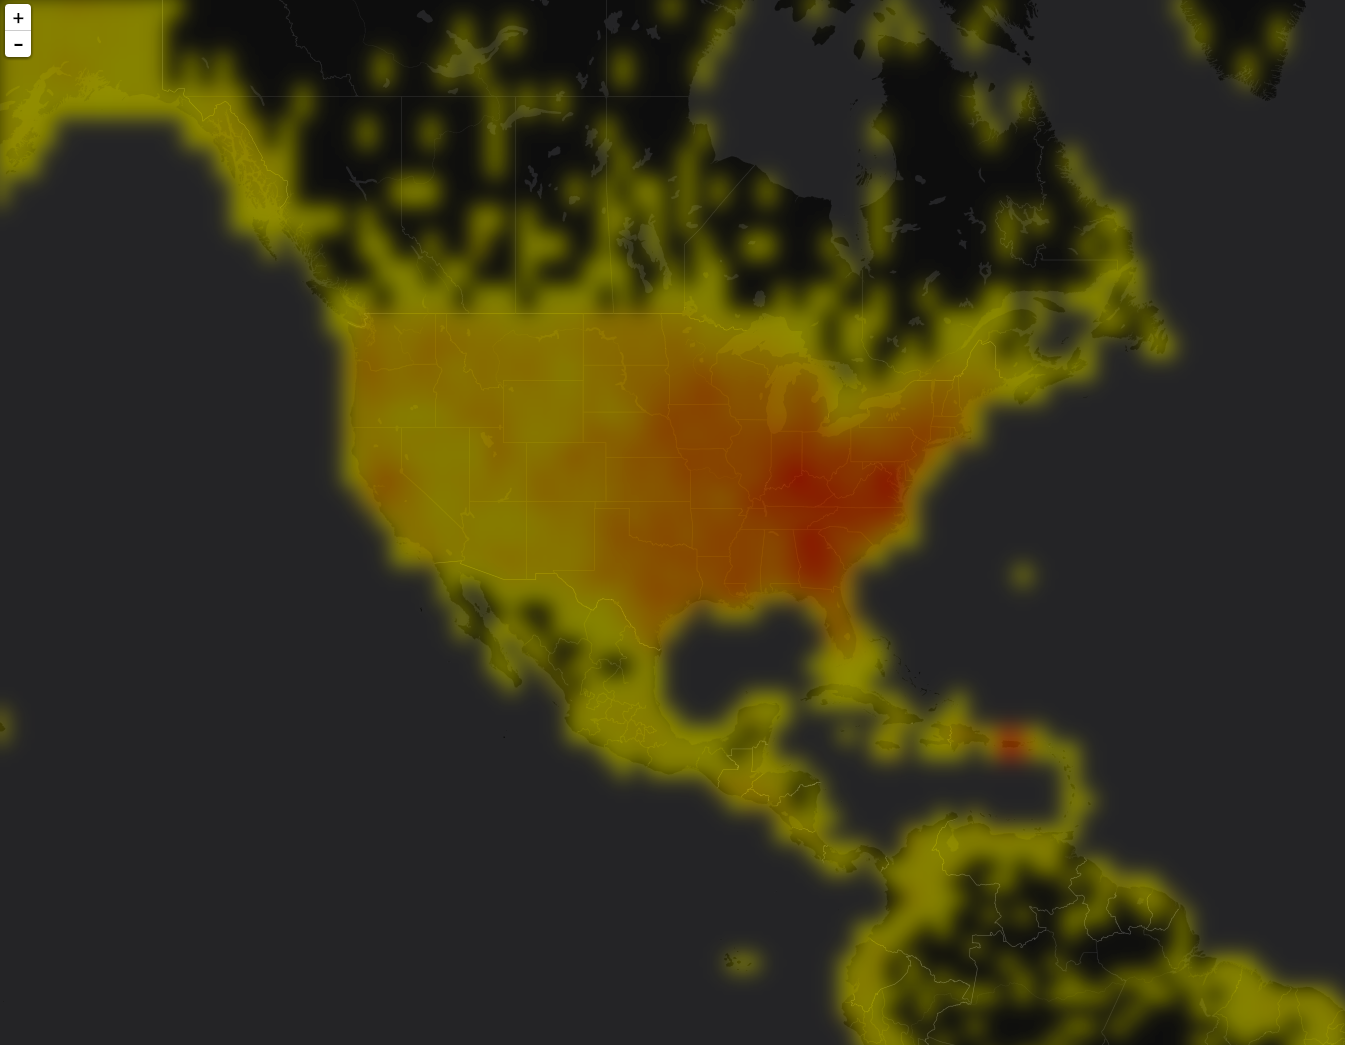
Hi folks,
I’m working on a project to expose Solr’s heatmap capability through
GeoServer. You can find details about Solr heatmaps here:
https://cwiki.apache.org/confluence/display/solr/Spatial+Search (search for
“Heatmap Faceting”.
But the gist of it is this: If you have a spatial field that uses the
recursive prefix tree type (ie. geohash) for indexing then it’s easy
using Solr’s facetting infrastructure to generate a heatmap grid. What
you get back from Solr is a 2D array representing the geohash grid,
where each value is a count of documents that intersect that grid
cell. Applying some symbolization you can get something that looks
like this:
https://raw.githubusercontent.com/voyagersearch/leaflet-solr-heatmap/master/sample.png
The above screen shot comes from a leaflet plugin that visualizes the
heatmap directly in the browser. I would like to add a similar looking
visualization for GeoTools/GeoServer.
My first thought was to expose this as a new type of coverage reader,
since the data is simple grid it falls into the model quite easily.
The major benefit of this approach is that becomes trivial to
configure in GeoServer and easy to style using all of the existing
raster symbology support. I’m interested to hear if others think this
is a good approach.
If that sounds good my plan was to add this to the existing solr
module. It won’t add any new dependencies aside from a dependency on
the coverage module.
@Andrea: you’re listed as the module maintainer… although if I recall
correctly we agreed to co-maintain the module?
I have a prototype working so if that all sounds good I’ll push up a
branch for folks to look at. One thing I am particular eager to get
some feed back on is how to best achieve the blur affect that makes
heatmaps look “
pretty”. At the moment what I have done is baked in a parameter to the
coverage format that specifies a blur radius and then when reading the
coverage I run it through the Convolve operation to achieve the
desired affect. It would be ideal if this could be done at
symbolization time. I’m wondering if we currently have any way to
define a blur or some similar effect at rendering time with sld? Would
a rendering transform work?
Thanks folks.

-Justin


------------------------------------------------------------------------------


_______________________________________________
GeoTools-Devel mailing list
[email protected]
https://lists.sourceforge.net/lists/listinfo/geotools-devel
------------------------------------------------------------------------------
_______________________________________________
GeoTools-Devel mailing list
[email protected]
https://lists.sourceforge.net/lists/listinfo/geotools-devel