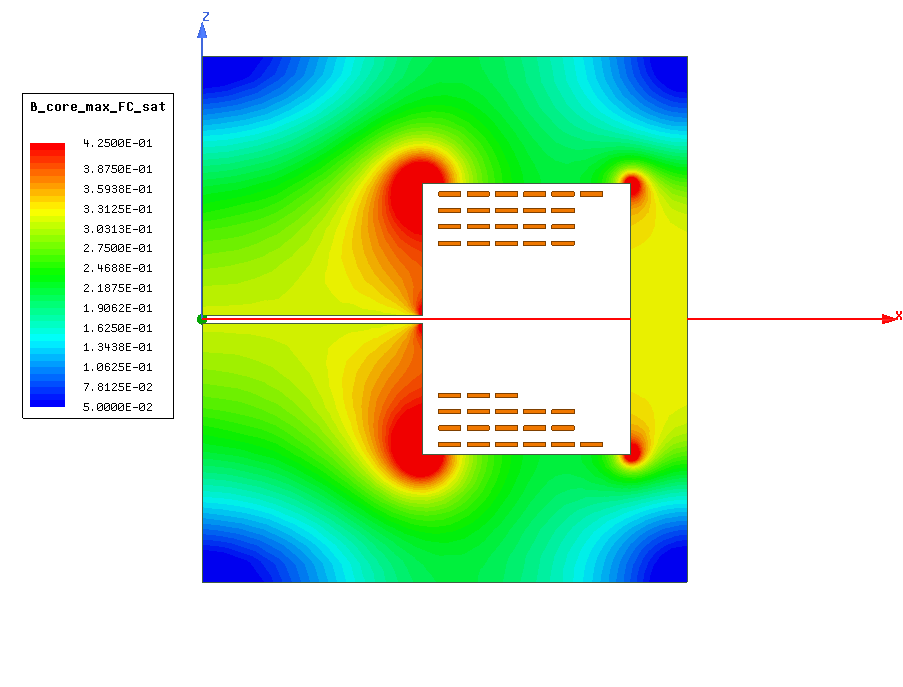
Hello,

I hope you can help me with this issue since I could not find an apropriate
solution so far. For my report I am not allowed to use diagrams with colors
which are not recognisable after a black/white copy anymore, like the one
attached to this message.
Since a normal greyscale of the attached plot makes blue (lowest value) and red
(highes value) looking similar. This is not an option.
I am seeking for a quick way to, let's say translate from a color range (blue to
red) to a grey scale (white to black). Since I have to do this for several
images I would appreciate a quick way, if there is one...
I heard that there are more than one weighting algorithms like (R+G+B)/2 or
0,3*R+0,7*B+0,11*G and so on, but basically I would be interested in 0*Blue +
maybe 30*Green + 70*Red to achieve White as a minimum (which is now marked with
blue color) and black as a maximum (which is now marked with red).

Thank you in anticipation.

Best regards.

Attachments:
* http://www.gimpusers.com/system/attachments/855/original/colored_plot.bmp

--
colorchange (via www.gimpusers.com/forums)
_______________________________________________
gimp-user-list mailing list
List address:    [email protected]
List membership: https://mail.gnome.org/mailman/listinfo/gimp-user-list
List archives:   https://mail.gnome.org/archives/gimp-user-list