There seems to be too many lookup operations compared to any other
operations. What is the workload on the volume?
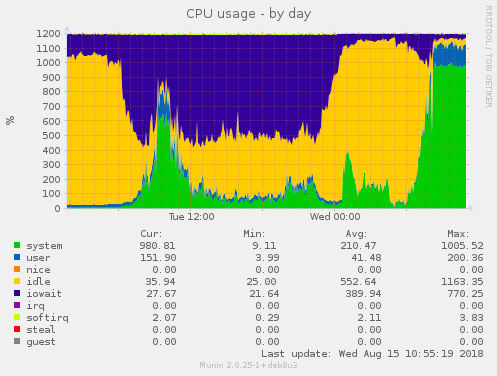
On Fri, Aug 17, 2018 at 12:47 PM Hu Bert <[email protected]> wrote:

> i hope i did get it right.
>
> gluster volume profile shared start
> wait 10 minutes
> gluster volume profile shared info
> gluster volume profile shared stop
>
> If that's ok, i've attached the output of the info command.
>
>
> 2018-08-17 8:31 GMT+02:00 Pranith Kumar Karampuri <[email protected]>:
> > Please do volume profile also for around 10 minutes when CPU% is high.
> >
> > On Fri, Aug 17, 2018 at 11:56 AM Pranith Kumar Karampuri
> > <[email protected]> wrote:
> >>
> >> As per the output, all io-threads are using a lot of CPU. It is better
> to
> >> check what the volume profile is to see what is leading to so much work
> for
> >> io-threads. Please follow the documentation at
> >>
> https://gluster.readthedocs.io/en/latest/Administrator%20Guide/Monitoring%20Workload/
> >> section: "
> >>
> >> Running GlusterFS Volume Profile Command"
> >>
> >> and attach output of  "gluster volume profile info",
> >>
> >> On Fri, Aug 17, 2018 at 11:24 AM Hu Bert <[email protected]>
> wrote:
> >>>
> >>> Good morning,
> >>>
> >>> i ran the command during 100% CPU usage and attached the file.
> >>> Hopefully it helps.
> >>>
> >>> 2018-08-17 7:33 GMT+02:00 Pranith Kumar Karampuri <[email protected]
> >:
> >>> > Could you do the following on one of the nodes where you are
> observing
> >>> > high
> >>> > CPU usage and attach that file to this thread? We can find what
> >>> > threads/processes are leading to high usage. Do this for say 10
> minutes
> >>> > when
> >>> > you see the ~100% CPU.
> >>> >
> >>> > top -bHd 5 > /tmp/top.${HOSTNAME}.txt
> >>> >
> >>> > On Wed, Aug 15, 2018 at 2:37 PM Hu Bert <[email protected]>
> wrote:
> >>> >>
> >>> >> Hello again :-)
> >>> >>
> >>> >> The self heal must have finished as there are no log entries in
> >>> >> glustershd.log files anymore. According to munin disk latency
> (average
> >>> >> io wait) has gone down to 100 ms, and disk utilization has gone down
> >>> >> to ~60% - both on all servers and hard disks.
> >>> >>
> >>> >> But now system load on 2 servers (which were in the good state)
> >>> >> fluctuates between 60 and 100; the server with the formerly failed
> >>> >> disk has a load of 20-30.I've uploaded some munin graphics of the
> cpu
> >>> >> usage:
> >>> >>
> >>> >> https://abload.de/img/gluster11_cpu31d3a.png
> >>> >> https://abload.de/img/gluster12_cpu8sem7.png
> >>> >> https://abload.de/img/gluster13_cpud7eni.png
> >>> >>
> >>> >> This can't be normal. 2 of the servers under heavy load and one not
> >>> >> that much. Does anyone have an explanation of this strange
> behaviour?
> >>> >>
> >>> >>
> >>> >> Thx :-)
> >>> >>
> >>> >> 2018-08-14 9:37 GMT+02:00 Hu Bert <[email protected]>:
> >>> >> > Hi there,
> >>> >> >
> >>> >> > well, it seems the heal has finally finished. Couldn't see/find
> any
> >>> >> > related log message; is there such a message in a specific log
> file?
> >>> >> >
> >>> >> > But i see the same behaviour when the last heal finished: all CPU
> >>> >> > cores are consumed by brick processes; not only by the formerly
> >>> >> > failed
> >>> >> > bricksdd1, but by all 4 brick processes (and their threads). Load
> >>> >> > goes
> >>> >> > up to > 100 on the 2 servers with the not-failed brick, and
> >>> >> > glustershd.log gets filled with a lot of entries. Load on the
> server
> >>> >> > with the then failed brick not that high, but still ~60.
> >>> >> >
> >>> >> > Is this behaviour normal? Is there some post-heal after a heal has
> >>> >> > finished?
> >>> >> >
> >>> >> > thx in advance :-)
> >>> >
> >>> >
> >>> >
> >>> > --
> >>> > Pranith
> >>
> >>
> >>
> >> --
> >> Pranith
> >
> >
> >
> > --
> > Pranith
>


--
Pranith
_______________________________________________
Gluster-users mailing list
[email protected]
https://lists.gluster.org/mailman/listinfo/gluster-users