On Mon, Mar 4, 2019 at 7:47 PM Raghavendra Gowdappa <[email protected]>
wrote:
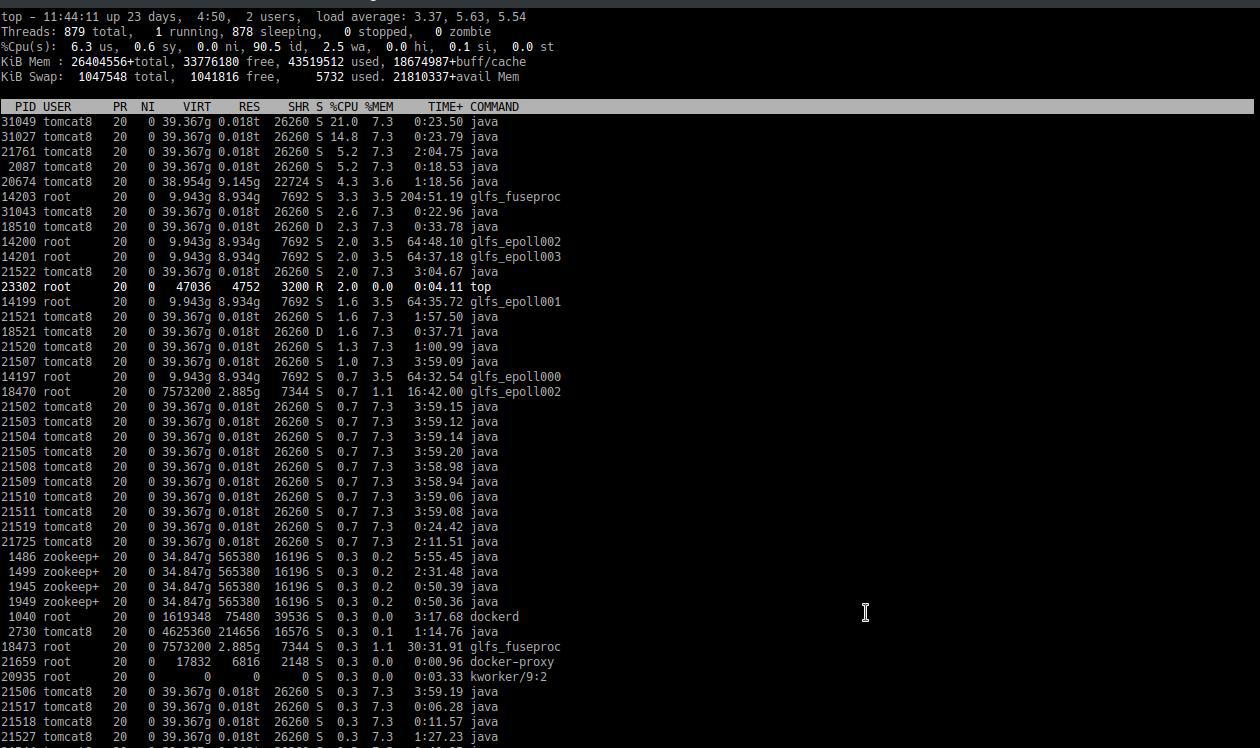
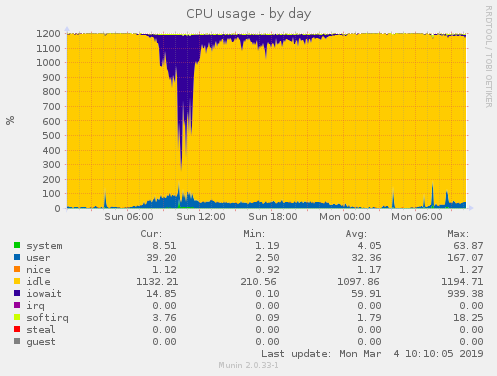
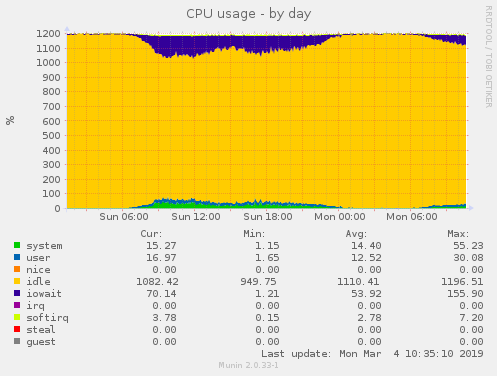
>
>
> On Mon, Mar 4, 2019 at 4:26 PM Hu Bert <[email protected]> wrote:
>
>> Hi Raghavendra,
>>
>> at the moment iowait and cpu consumption is quite low, the main
>> problems appear during the weekend (high traffic, especially on
>> sunday), so either we have to wait until next sunday or use a time
>> machine ;-)
>>
>> I made a screenshot of top (https://abload.de/img/top-hvvjt2.jpg) and
>> a text output (https://pastebin.com/TkTWnqxt), maybe that helps. Seems
>> like processes like glfs_fuseproc (>204h) and glfs_epoll (64h for each
>> process) consume a lot of CPU (uptime 24 days). Is that already
>> helpful?
>>
>
> Not much. The TIME field just says the amount of time the thread has been
> executing. Since its a long standing mount, we can expect such large
> values. But, the value itself doesn't indicate whether the thread itself
> was overloaded at any (some) interval(s).
>
> Can you please collect output of following command and send back the
> collected data?
>
> # top -bHd 3 > top.output
>

Please collect this on problematic mounts and bricks.


>
>>
>> Hubert
>>
>> Am Mo., 4. März 2019 um 11:31 Uhr schrieb Raghavendra Gowdappa
>> <[email protected]>:
>> >
>> > what is the per thread CPU usage like on these clients? With highly
>> concurrent workloads we've seen single thread that reads requests from
>> /dev/fuse (fuse reader thread) becoming bottleneck. Would like to know what
>> is the cpu usage of this thread looks like (you can use top -H).
>> >
>> > On Mon, Mar 4, 2019 at 3:39 PM Hu Bert <[email protected]> wrote:
>> >>
>> >> Good morning,
>> >>
>> >> we use gluster v5.3 (replicate with 3 servers, 2 volumes, raid10 as
>> >> brick) with at the moment 10 clients; 3 of them do heavy I/O
>> >> operations (apache tomcats, read+write of (small) images). These 3
>> >> clients have a quite high I/O wait (stats from yesterday) as can be
>> >> seen here:
>> >>
>> >> client: https://abload.de/img/client1-cpu-dayulkza.png
>> >> server: https://abload.de/img/server1-cpu-dayayjdq.png
>> >>
>> >> The iowait in the graphics differ a lot. I checked netstat for the
>> >> different clients; the other clients have 8 open connections:
>> >> https://pastebin.com/bSN5fXwc
>> >>
>> >> 4 for each server and each volume. The 3 clients with the heavy I/O
>> >> have (at the moment) according to netstat 170, 139 and 153
>> >> connections. An example for one client can be found here:
>> >> https://pastebin.com/2zfWXASZ
>> >>
>> >> gluster volume info: https://pastebin.com/13LXPhmd
>> >> gluster volume status: https://pastebin.com/cYFnWjUJ
>> >>
>> >> I just was wondering if the iowait is based on the clients and their
>> >> workflow: requesting a lot of files (up to hundreds per second),
>> >> opening a lot of connections and the servers aren't able to answer
>> >> properly. Maybe something can be tuned here?
>> >>
>> >> Especially the server|client.event-threads (both set to 4) and
>> >> performance.(high|normal|low|least)-prio-threads (all at default value
>> >> 16) and performance.io-thread-count (32) options, maybe these aren't
>> >> properly configured for up to 170 client connections.
>> >>
>> >> Both servers and clients have a Xeon CPU (6 cores, 12 threads), a 10
>> >> GBit connection and 128G (servers) respectively 256G (clients) RAM.
>> >> Enough power :-)
>> >>
>> >>
>> >> Thx for reading && best regards,
>> >>
>> >> Hubert
>> >> _______________________________________________
>> >> Gluster-users mailing list
>> >> [email protected]
>> >> https://lists.gluster.org/mailman/listinfo/gluster-users
>>
>
_______________________________________________
Gluster-users mailing list
[email protected]
https://lists.gluster.org/mailman/listinfo/gluster-users