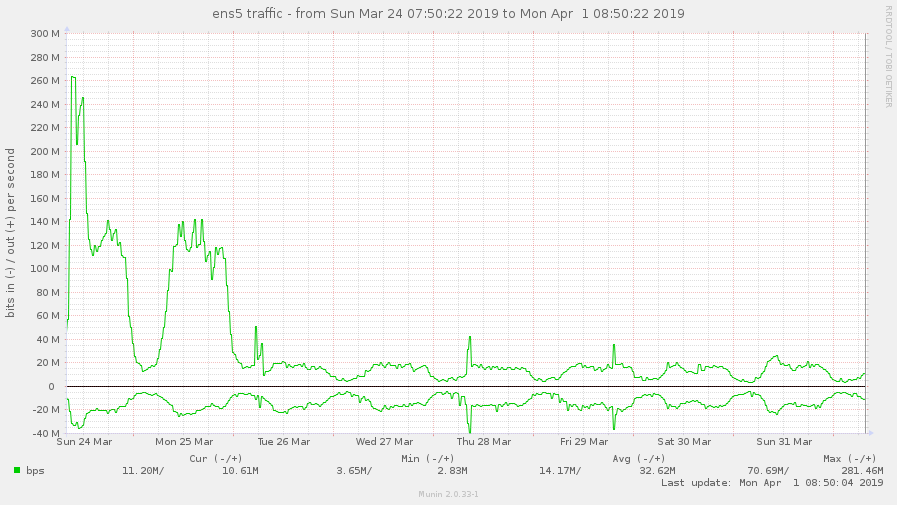
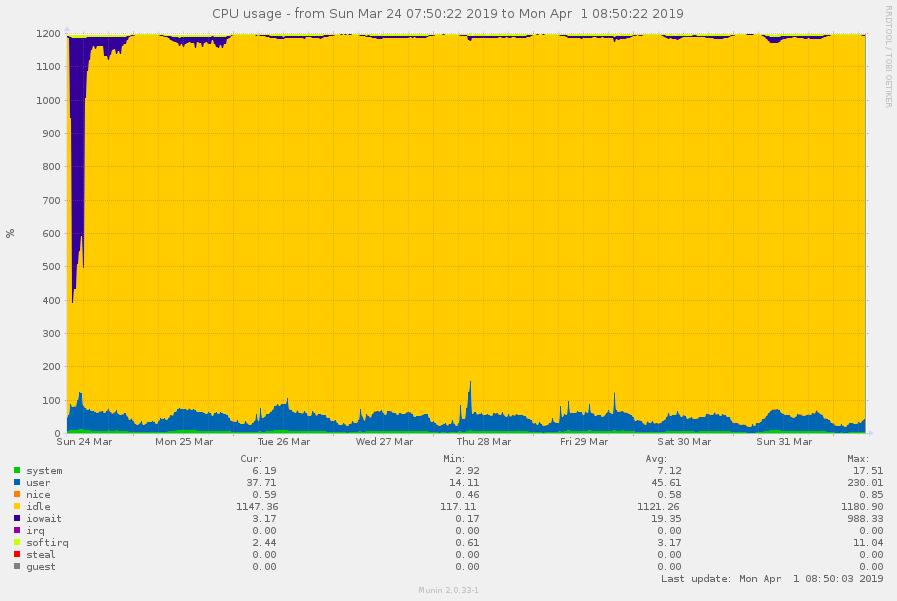
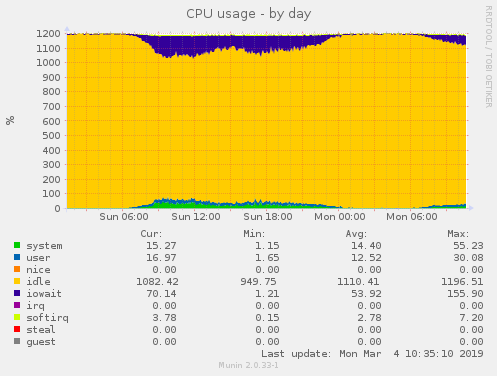
Good morning,

it seems like setting performance.quick-read to off (context:
increased network traffic
https://bugzilla.redhat.com/show_bug.cgi?id=1673058) solved the main
problem. See those 2 munin graphs, especially network and iowait on
March 24th and 31st (high traffic days); param was set to off on March
26th.
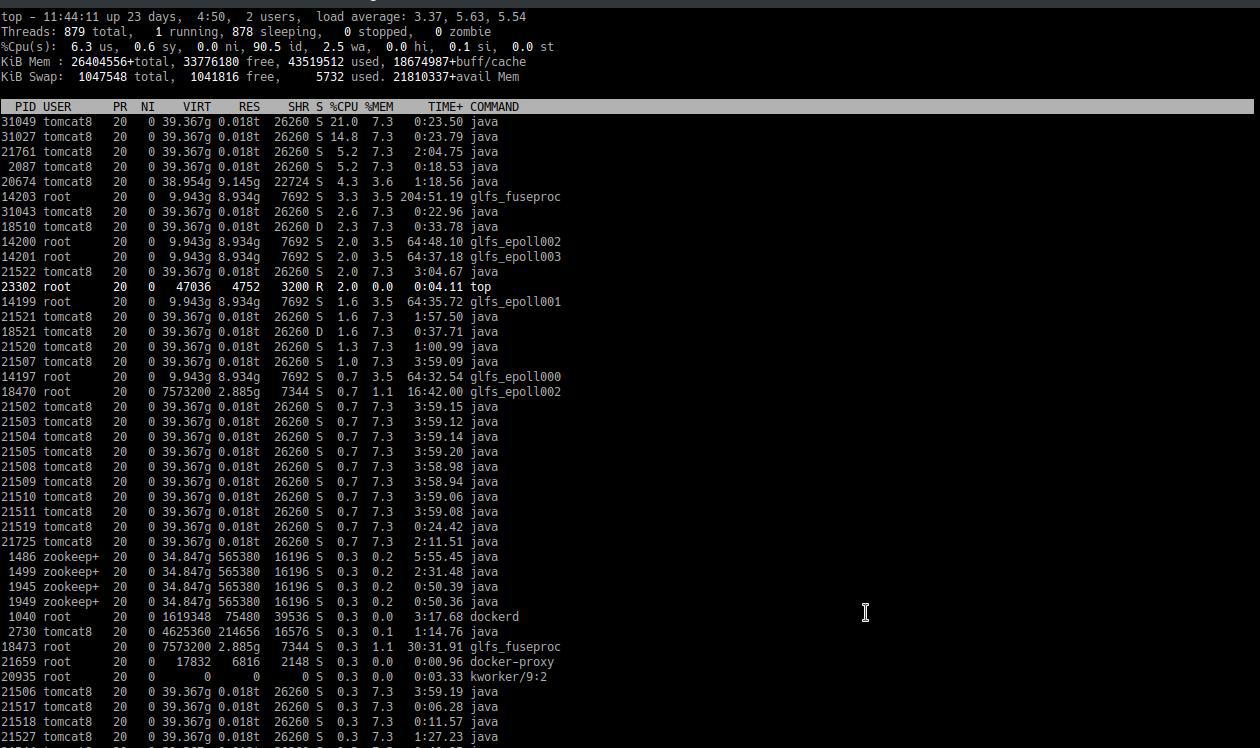
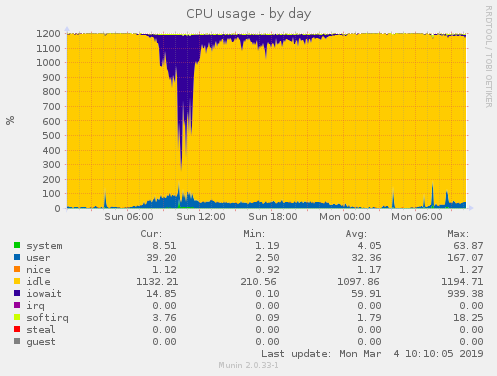
network: https://abload.de/img/client-internal-netwoh3kh7.png
cpu: https://abload.de/img/client-cpu-iowaitatkfc.png

I'll keep watching this, but hopefully the problems have disappeared.
Awaiting glusterfs v5.6 with the bugfix; then, after re-enabling
quick-read, i'll check again.


Regards,
Hubert

Am Fr., 29. März 2019 um 07:47 Uhr schrieb Hu Bert <[email protected]>:
>
> Hi Raghavendra,
>
> i'll try to gather the information you need, hopefully this weekend.
>
> One thing i've done this week: deactivate performance.quick-read
> (https://bugzilla.redhat.com/show_bug.cgi?id=1673058), which
> (according to munin) ended in a massive drop in network traffic and a
> slightly lower iowait. Maybe that has helped already. We'll see.
>
> performance.nl-cache is deactivated due to unreadable
> files/directories; we have a highly concurrent workload. There are
> some nginx backend webservers that check if a requested file exists in
> the glusterfs filesystem; i counted the log entries, this can be up to
> 5 million entries a day; about 2/3 of the files are found in the
> filesystem, they get delivered to the frontend; if not: the nginx's
> send the  request via round robin to 3 backend tomcats, and they have
> to check whether a directory exists or not (and then create it and the
> requested files). So it happens that tomcatA creates a directory and a
> file in it, and within (milli)seconds tomcatB+C create additional
> files in this dir.
>
> Deactivating nl-cache helped to solve this issue, after having
> conversation with Nithya and Ravishankar. Just wanted to explain that.
>
>
> Thx so far,
> Hubert
>
> Am Fr., 29. März 2019 um 06:29 Uhr schrieb Raghavendra Gowdappa
> <[email protected]>:
> >
> > +Gluster-users
> >
> > Sorry about the delay. There is nothing suspicious about per thread CPU
> > utilization of glusterfs process. However looking at the volume profile
> > attached I see huge number of lookups. I think if we cutdown the number of
> > lookups probably we'll see improvements in performance. I need following
> > information:
> >
> > * dump of fuse traffic under heavy load (use --dump-fuse option while
> > mounting)
> > * client volume profile for the duration of heavy load -
> > https://docs.gluster.org/en/latest/Administrator%20Guide/Performance%20Testing/
> > * corresponding brick volume profile
> >
> > Basically I need to find out
> > * whether these lookups are on existing files or non-existent files
> > * whether they are on directories or files
> > * why/whether md-cache or kernel attribute cache or nl-cache will help to
> > cut down lookups.
> >
> > regards,
> > Raghavendra
> >
> > On Mon, Mar 25, 2019 at 12:13 PM Hu Bert <[email protected]> wrote:
> >>
> >> Hi Raghavendra,
> >>
> >> sorry, this took a while. The last weeks the weather was bad -> less
> >> traffic, but this weekend there was a massive peak. I made 3 profiles
> >> with top, but at first look there's nothing special here.
> >>
> >> I also made a gluster profile (on one of the servers) at a later
> >> moment. Maybe that helps. I also added some munin graphics from 2 of
> >> the clients and 1 graphic of server network, just to show how massive
> >> the problem is.
> >>
> >> Just wondering if the high io wait is related to the high network
> >> traffic bug (https://bugzilla.redhat.com/show_bug.cgi?id=1673058); if
> >> so, i could deactivate performance.quick-read and check if there is
> >> less iowait. If that helps: wonderful - and yearningly awaiting
> >> updated packages (e.g. v5.6). If not: maybe we have to switch from our
> >> normal 10TB hdds (raid10) to SSDs if the problem is based on slow
> >> hardware in the use case of small files (images).
> >>
> >>
> >> Thx,
> >> Hubert
> >>
> >> Am Mo., 4. März 2019 um 16:59 Uhr schrieb Raghavendra Gowdappa
> >> <[email protected]>:
> >> >
> >> > Were you seeing high Io-wait when you captured the top output? I guess
> >> > not as you mentioned the load increases during weekend. Please note that
> >> > this data has to be captured when you are experiencing problems.
> >> >
> >> > On Mon, Mar 4, 2019 at 8:02 PM Hu Bert <[email protected]> wrote:
> >> >>
> >> >> Hi,
> >> >> sending the link directly to  you and not the list, you can distribute
> >> >> if necessary. the command ran for about half a minute. Is that enough?
> >> >> More? Less?
> >> >>
> >> >> https://download.outdooractive.com/top.output.tar.gz
> >> >>
> >> >> Am Mo., 4. März 2019 um 15:21 Uhr schrieb Raghavendra Gowdappa
> >> >> <[email protected]>:
> >> >> >
> >> >> >
> >> >> >
> >> >> > On Mon, Mar 4, 2019 at 7:47 PM Raghavendra Gowdappa
> >> >> > <[email protected]> wrote:
> >> >> >>
> >> >> >>
> >> >> >>
> >> >> >> On Mon, Mar 4, 2019 at 4:26 PM Hu Bert <[email protected]>
> >> >> >> wrote:
> >> >> >>>
> >> >> >>> Hi Raghavendra,
> >> >> >>>
> >> >> >>> at the moment iowait and cpu consumption is quite low, the main
> >> >> >>> problems appear during the weekend (high traffic, especially on
> >> >> >>> sunday), so either we have to wait until next sunday or use a time
> >> >> >>> machine ;-)
> >> >> >>>
> >> >> >>> I made a screenshot of top (https://abload.de/img/top-hvvjt2.jpg)
> >> >> >>> and
> >> >> >>> a text output (https://pastebin.com/TkTWnqxt), maybe that helps.
> >> >> >>> Seems
> >> >> >>> like processes like glfs_fuseproc (>204h) and glfs_epoll (64h for
> >> >> >>> each
> >> >> >>> process) consume a lot of CPU (uptime 24 days). Is that already
> >> >> >>> helpful?
> >> >> >>
> >> >> >>
> >> >> >> Not much. The TIME field just says the amount of time the thread has
> >> >> >> been executing. Since its a long standing mount, we can expect such
> >> >> >> large values. But, the value itself doesn't indicate whether the
> >> >> >> thread itself was overloaded at any (some) interval(s).
> >> >> >>
> >> >> >> Can you please collect output of following command and send back the
> >> >> >> collected data?
> >> >> >>
> >> >> >> # top -bHd 3 > top.output
> >> >> >
> >> >> >
> >> >> > Please collect this on problematic mounts and bricks.
> >> >> >
> >> >> >>
> >> >> >>>
> >> >> >>>
> >> >> >>> Hubert
> >> >> >>>
> >> >> >>> Am Mo., 4. März 2019 um 11:31 Uhr schrieb Raghavendra Gowdappa
> >> >> >>> <[email protected]>:
> >> >> >>> >
> >> >> >>> > what is the per thread CPU usage like on these clients? With
> >> >> >>> > highly concurrent workloads we've seen single thread that reads
> >> >> >>> > requests from /dev/fuse (fuse reader thread) becoming bottleneck.
> >> >> >>> > Would like to know what is the cpu usage of this thread looks
> >> >> >>> > like (you can use top -H).
> >> >> >>> >
> >> >> >>> > On Mon, Mar 4, 2019 at 3:39 PM Hu Bert <[email protected]>
> >> >> >>> > wrote:
> >> >> >>> >>
> >> >> >>> >> Good morning,
> >> >> >>> >>
> >> >> >>> >> we use gluster v5.3 (replicate with 3 servers, 2 volumes, raid10
> >> >> >>> >> as
> >> >> >>> >> brick) with at the moment 10 clients; 3 of them do heavy I/O
> >> >> >>> >> operations (apache tomcats, read+write of (small) images). These
> >> >> >>> >> 3
> >> >> >>> >> clients have a quite high I/O wait (stats from yesterday) as can
> >> >> >>> >> be
> >> >> >>> >> seen here:
> >> >> >>> >>
> >> >> >>> >> client: https://abload.de/img/client1-cpu-dayulkza.png
> >> >> >>> >> server: https://abload.de/img/server1-cpu-dayayjdq.png
> >> >> >>> >>
> >> >> >>> >> The iowait in the graphics differ a lot. I checked netstat for
> >> >> >>> >> the
> >> >> >>> >> different clients; the other clients have 8 open connections:
> >> >> >>> >> https://pastebin.com/bSN5fXwc
> >> >> >>> >>
> >> >> >>> >> 4 for each server and each volume. The 3 clients with the heavy
> >> >> >>> >> I/O
> >> >> >>> >> have (at the moment) according to netstat 170, 139 and 153
> >> >> >>> >> connections. An example for one client can be found here:
> >> >> >>> >> https://pastebin.com/2zfWXASZ
> >> >> >>> >>
> >> >> >>> >> gluster volume info: https://pastebin.com/13LXPhmd
> >> >> >>> >> gluster volume status: https://pastebin.com/cYFnWjUJ
> >> >> >>> >>
> >> >> >>> >> I just was wondering if the iowait is based on the clients and
> >> >> >>> >> their
> >> >> >>> >> workflow: requesting a lot of files (up to hundreds per second),
> >> >> >>> >> opening a lot of connections and the servers aren't able to
> >> >> >>> >> answer
> >> >> >>> >> properly. Maybe something can be tuned here?
> >> >> >>> >>
> >> >> >>> >> Especially the server|client.event-threads (both set to 4) and
> >> >> >>> >> performance.(high|normal|low|least)-prio-threads (all at default
> >> >> >>> >> value
> >> >> >>> >> 16) and performance.io-thread-count (32) options, maybe these
> >> >> >>> >> aren't
> >> >> >>> >> properly configured for up to 170 client connections.
> >> >> >>> >>
> >> >> >>> >> Both servers and clients have a Xeon CPU (6 cores, 12 threads),
> >> >> >>> >> a 10
> >> >> >>> >> GBit connection and 128G (servers) respectively 256G (clients)
> >> >> >>> >> RAM.
> >> >> >>> >> Enough power :-)
> >> >> >>> >>
> >> >> >>> >>
> >> >> >>> >> Thx for reading && best regards,
> >> >> >>> >>
> >> >> >>> >> Hubert
> >> >> >>> >> _______________________________________________
> >> >> >>> >> Gluster-users mailing list
> >> >> >>> >> [email protected]
> >> >> >>> >> https://lists.gluster.org/mailman/listinfo/gluster-users
_______________________________________________
Gluster-users mailing list
[email protected]
https://lists.gluster.org/mailman/listinfo/gluster-users