Hi,

this is bad.. and how should i reactif no data point is available what
should i return back that i become no error? or what is the best method to
delete the Map chart ? the clearChart function did not work there!
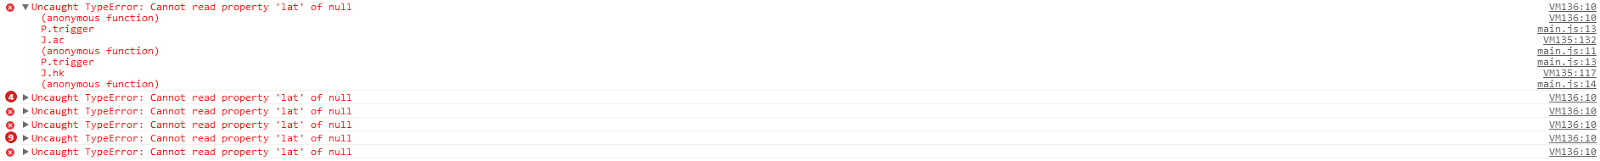
Am Donnerstag, 4. September 2014 00:59:17 UTC+2 schrieb Andrew Gallant:
>
> Ahh, I see.  The Map visualization expects at least one data point, and
> there is no way to override that behavior.
>
> On Monday, September 1, 2014 12:00:49 PM UTC-4, cyb wrote:
>>
>> Hi,
>>
>> ok i have created a simple example in jsfiddle and there is the same
>> error(i use chrome as browser):
>> This error appears only if the rows[] array is empty for example if the
>> getFilteredRows() method finds nothing..
>>
>> http://jsfiddle.net/cyb2k/z8s8t1tb/10/
>>
>> you must open the console and wait maybe a few seconds then the error in
>> my picture above appears. If you click with the mouse on the chart it
>> produces more errors..
>>
>> Am Montag, 1. September 2014 16:19:23 UTC+2 schrieb Andrew Gallant:
>>>
>>> Can you create a simplified example that demonstrate this behavior so I
>>> can test it?
>>>
>>> On Sunday, August 31, 2014 5:36:38 PM UTC-4, cyb wrote:
>>>>
>>>> Hi,
>>>>
>>>> ok i have found another problem..  i use the "Map" Chart with a
>>>> chartWrapper and i build a filtered view like this(I use the latitude
>>>> longitude mode):
>>>> var filteredView ={columns : [0,1,2], rows :
>>>> dataTable.getFilteredRows([{column: 2, minValue: 100, maxValue: null}])};
>>>>
>>>> so for example the minValue is 100, but 100 did not exists in the
>>>> DataTable. This is no problem by other charts but if the
>>>>  dataTable.getFilteredRows() method did not find any results and i give
>>>> this view to my chartWrapper it throws an ugly error message. It looks
>>>> like
>>>> this:
>>>>
>>>>
>>>> <https://lh5.googleusercontent.com/-c1ksluWoPu4/VAOUHMfNZnI/AAAAAAAAAAM/4wUY_iPR-eI/s1600/GeoMAPerror.PNG>
>>>>
>>>>
>>>> How can i solve this problem if my filter did not find a result ? Can i
>>>> display an empty chart or an chart with no markers ?
>>>> and the problem that "chartWrapper.getChart().clearChart();" is not
>>>> working with a  "Map" Chart, still exists...
>>>> Am Sonntag, 31. August 2014 00:52:53 UTC+2 schrieb cyb:
>>>>>
>>>>> Hi,
>>>>>
>>>>> ok i have fixed the problem, i did transform Column 3 in a String and
>>>>> add a tooltip directliy in my view like this:
>>>>> var toolTip=[
>>>>>                                 {
>>>>>                                     type: 'string',
>>>>>                                     role: 'tooltip',
>>>>>                                     calc: function(dt,row){
>>>>>                                         return
>>>>> 'Column:'+dt.getColumnLabel(3);
>>>>>                                     }
>>>>>
>>>>>                                 }
>>>>>                             ];
>>>>>
>>>>>
>>>>> the only problem is now, that the markers are to big, can i adjust the
>>>>> size of all markers in the options ? i need only one size for all markers!
>>>>>
>>>>> and i have a second Question..
>>>>> i have tried the Geo MAP, there is the same problem with Strings, but
>>>>> my custom tooltip above did not work there! is it possible to add custom
>>>>> tooltips to the Geo MAP(google maps) !?
>>>>>
>>>>> and i use a chartwrapper... normally i clear my chart
>>>>> with "chartWrapper.getChart().clearChart();" but this did not work with
>>>>> google maps, is there something similar to clear the chart if i use
>>>>> google
>>>>> maps !?
>>>>>
>>>>> Am Freitag, 29. August 2014 23:57:24 UTC+2 schrieb cyb:
>>>>>>
>>>>>> Hi,
>>>>>>
>>>>>> i want implement a GeoChart
>>>>>> https://developers.google.com/chart/interactive/docs/gallery/geochart?hl=de
>>>>>>
>>>>>> i have a DataTable with some Date Values but it seems that a GeoChart
>>>>>> can not handle Date values, is this true ?
>>>>>>
>>>>>> then i have tried to stringify my Date Values, this works but then
>>>>>> the tooltips did only show the value!
>>>>>>
>>>>>> if you go to this page
>>>>>> https://developers.google.com/chart/interactive/docs/gallery/geochart?hl=de
>>>>>>
>>>>>> and open the first jsfiddle link.
>>>>>>
>>>>>> The Tooltip shows for Canada:
>>>>>>
>>>>>> Canada
>>>>>> Popularity: 500
>>>>>>
>>>>>> this is correct, but if i replace the numbers with strings like this:
>>>>>>
>>>>>>         var data = google.visualization.arrayToDataTable([
>>>>>>           ['Country', 'Popularity'],
>>>>>>           ['Germany', 'A'],
>>>>>>           ['United States', 'B'],
>>>>>>           ['Brazil', 'C'],
>>>>>>           ['Canada', 'D'],
>>>>>>           ['France', 'E'],
>>>>>>           ['RU', 'F']
>>>>>>         ]);
>>>>>>
>>>>>> it shows only "D" but i want this:
>>>>>>
>>>>>> Canada
>>>>>> Popularity: D
>>>>>>
>>>>>> how can i fix this !?
>>>>>>
>>>>>> The same problem is with the latitude and longitude mode!
>>>>>>
>>>>>> i use a DataWrapper and i build my own view, i do the stringify like
>>>>>> this:
>>>>>>
>>>>>> var latLongView=[0,1];
>>>>>>  var xyViewStringify = [
>>>>>>                     {
>>>>>>                         sourceColumn: 2,
>>>>>>                         type: 'string',
>>>>>>                         calc: 'stringify'
>>>>>>                     }
>>>>>>                 ];
>>>>>>
>>>>>>                 //-----------------------------------
>>>>>>                 latLongView.push.apply(latLongView, xyViewStringify);
>>>>>>
>>>>>> this works but the problem is the wrong tooltip!!
>>>>>>
>>>>>

--
You received this message because you are subscribed to the Google Groups
"Google Visualization API" group.
To unsubscribe from this group and stop receiving emails from it, send an email
to [email protected].
To post to this group, send email to [email protected].
Visit this group at http://groups.google.com/group/google-visualization-api.
For more options, visit https://groups.google.com/d/optout.