Hello,

I have a line graph set up using time intervals and I would like to use a
trending line, however those are only available with continuous axes.
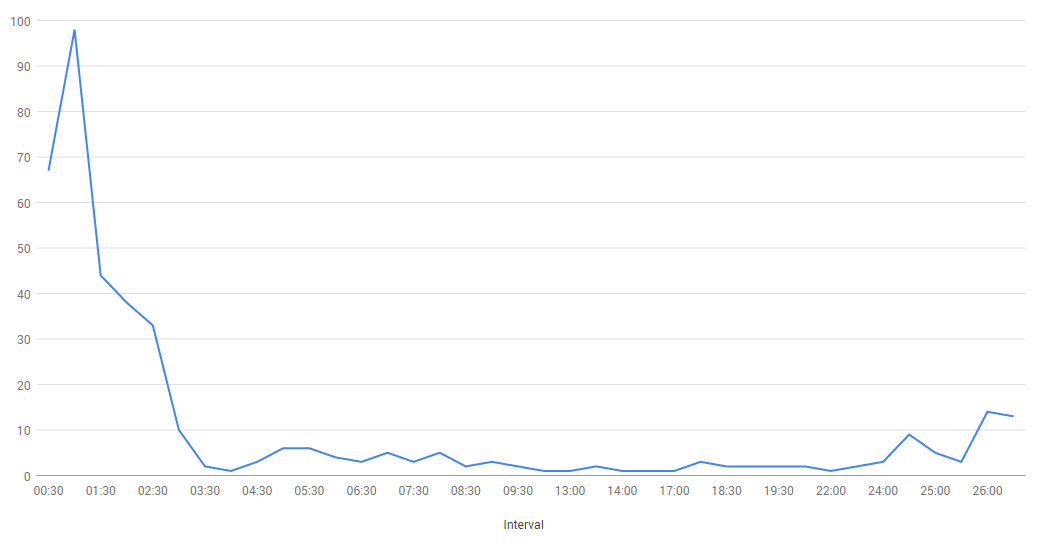
https://developers.google.com/chart/interactive/docs/customizing_axes#Discrete_vs_Continuous

There is already 'number', 'date', 'datetime' and 'timeofday' available as
a continuous axis, it would be really nice to have 'interval' added as a
continuous axis as well.

Here's an example of the graph that I have, it's showing a number of events
across an interval of time.

<https://lh6.googleusercontent.com/-pqMA5zXqHPE/VPDFgO-BFiI/AAAAAAAAABs/OJ-LFTvVtYk/s1600/line%2Bgraph.PNG>

The intervals are technically continuous since they are every 30 minutes,
but are not displayed that way due to 'string' being the only column type
that the API will allow me to use with them.

Is there a way to achieve this with the currently available API options?  I
was thinking that I could use 'timeofday' but it did not like the input
values (00:00, 00:30) for that type.

Thanks,

-Don

--
You received this message because you are subscribed to the Google Groups
"Google Visualization API" group.
To unsubscribe from this group and stop receiving emails from it, send an email
to [email protected].
To post to this group, send email to [email protected].
Visit this group at http://groups.google.com/group/google-visualization-api.
For more options, visit https://groups.google.com/d/optout.