Jonas,

This is a bug that I suspect we can narrow down to the February release,
v41.   I have some fixes that won't be ready until the next release, v43.
A workaround in the meantime is that you can specify a viewWindow.max value
that is large enough to include your data.  e.g.
var options = {
..
hAxis: { viewWindow: { max: [2, 0, 0] } }
}
On Thu, Apr 23, 2015 at 7:38 AM, Jonas Eriksson <[email protected]>
wrote:
> Hi,
>
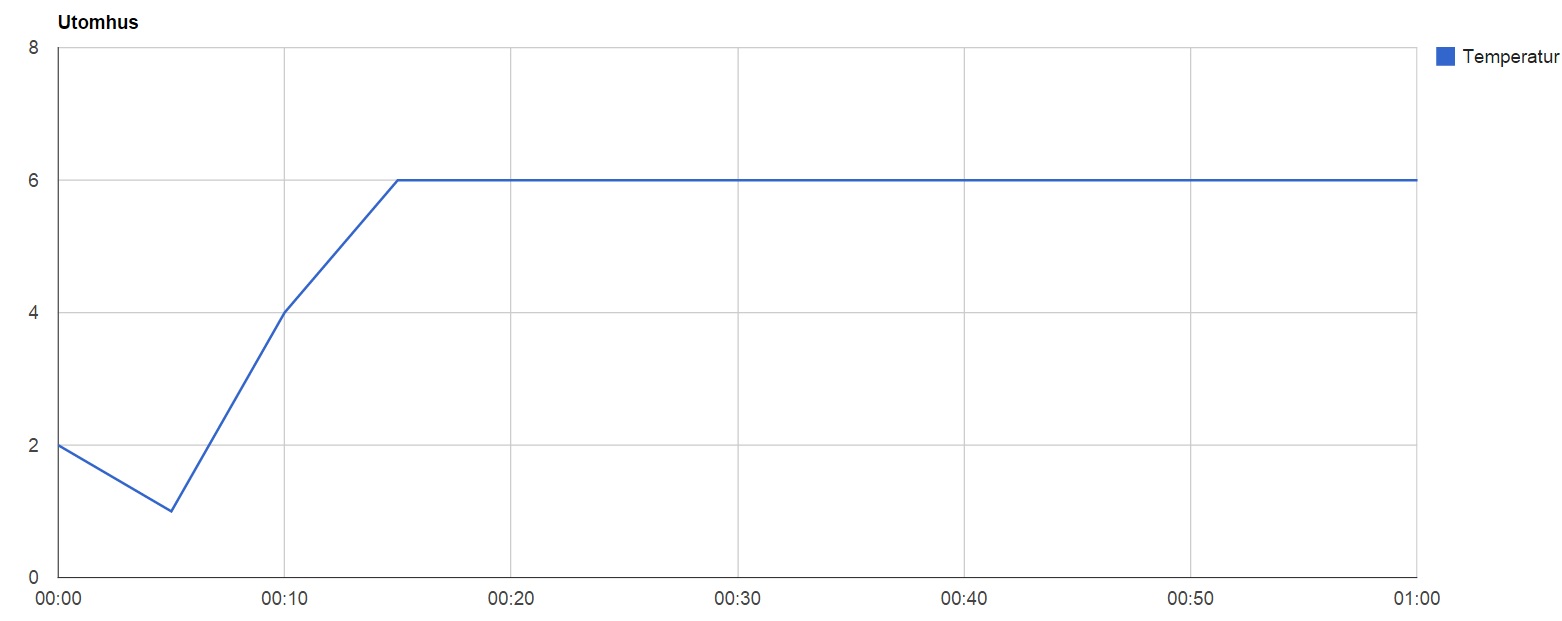
> I've been using this API for about a year to visualize my temperatures at
> home. It has all worked out great until a couple of weeks ago when suddenly
> the auto scale on the horizontal axis when using timeofday cuts values at
> the end of the data table. It looks like all the data until the last
> automatically created legend is in the graph but the rest of the values are
> cut out. Below you can see some example code and a screenshot to visualize
> the problem. I've tried to do a work around but have not succeded. My
> question is if it is supposed to work like this or if it is a bug? If it is
> supposed to work like that does abyone have a workaround that could work?
>
> Example code:
> <html>
> <head>
> <script type="text/javascript" src="https://www.google.com/jsapi
> "></script>
> <script type="text/javascript">
> google.load("visualization", "1", {packages:["corechart"]});
> google.setOnLoadCallback(drawChart);
> function drawChart() {
> var data = new google.visualization.DataTable();
> data.addColumn('timeofday', 'Tid');
> data.addColumn('number', 'Temperatur');
>
> data.addRows([
> [[0, 0, 0, 0], 2],
> [[0, 5, 0, 0], 1],
> [[0, 10, 0, 0], 4],
> [[0, 15, 0, 0], 6],
> [[0, 20, 0, 0], 6],
> [[0, 25, 0, 0], 6],
> [[0, 30, 0, 0], 6],
> [[0, 35, 0, 0], 6],
> [[0, 40, 0, 0], 6],
> [[0, 45, 0, 0], 6],
> [[0, 50, 0, 0], 6],
> [[0, 55, 0, 0], 6],
> [[1, 0, 0, 0], 6],
> [[1, 5, 0, 0], 6]
> ]);
>
> var options = {
> title: 'Utomhus',
> chartArea:{left:50,top:40,width:"85%",height:"85%"},
> };
>
> var chart = new
> google.visualization.LineChart(document.getElementById('chart_div'));
> chart.draw(data, options);
> }
> </script>
> </head>
> <body>
> <div id="chart_div" style="width: 1280px; height: 500px;"></div>
> </body>
> </html>
>
> Picture:
>
>
> <https://lh3.googleusercontent.com/-KtuJtjYXCFs/VTjZrjvQJsI/AAAAAAAAJqs/_LUBcpCUdiQ/s1600/Example.jpg>
>
>
> --
> You received this message because you are subscribed to the Google Groups
> "Google Visualization API" group.
> To unsubscribe from this group and stop receiving emails from it, send an
> email to [email protected].
> To post to this group, send email to
> [email protected].
> Visit this group at
> http://groups.google.com/group/google-visualization-api.
> For more options, visit https://groups.google.com/d/optout.
>
--
Daniel LaLiberte <https://plus.google.com/100631381223468223275?prsrc=2> -
978-394-1058
[email protected] <[email protected]> 5CC, Cambridge MA
[email protected] <[email protected]> 9 Juniper Ridge
Road, Acton MA
--
You received this message because you are subscribed to the Google Groups
"Google Visualization API" group.
To unsubscribe from this group and stop receiving emails from it, send an email
to [email protected].
To post to this group, send email to [email protected].
Visit this group at http://groups.google.com/group/google-visualization-api.
For more options, visit https://groups.google.com/d/optout.