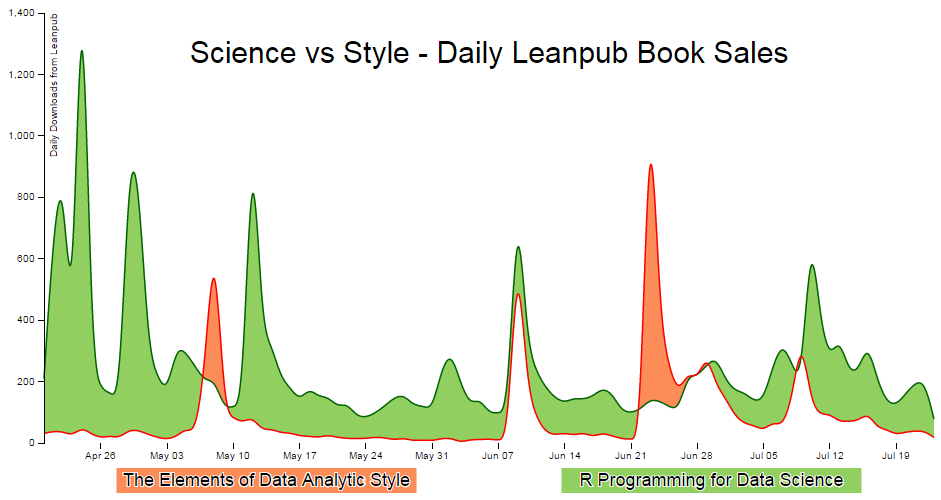
I'm trying to make a difference chart (example
<http://3.bp.blogspot.com/-XIhWf7a4QKU/VbQqfxldvkI/AAAAAAAABfQ/hJLTnLXkHUU/s1600/difference-10.png>),

but I can't seem to figure it out.  Basically, I just want to show two
curves, and I want to highlight the area between the curves where the color
of this area depends on which curve is "on top".  Does anyone have any idea
how to do this?
Thanks!


--
You received this message because you are subscribed to the Google Groups
"Google Visualization API" group.
To unsubscribe from this group and stop receiving emails from it, send an email
to [email protected].
To post to this group, send email to [email protected].
Visit this group at https://groups.google.com/group/google-visualization-api.
To view this discussion on the web visit
https://groups.google.com/d/msgid/google-visualization-api/bea14ded-3732-431d-b628-23ec1cc765da%40googlegroups.com.
For more options, visit https://groups.google.com/d/optout.