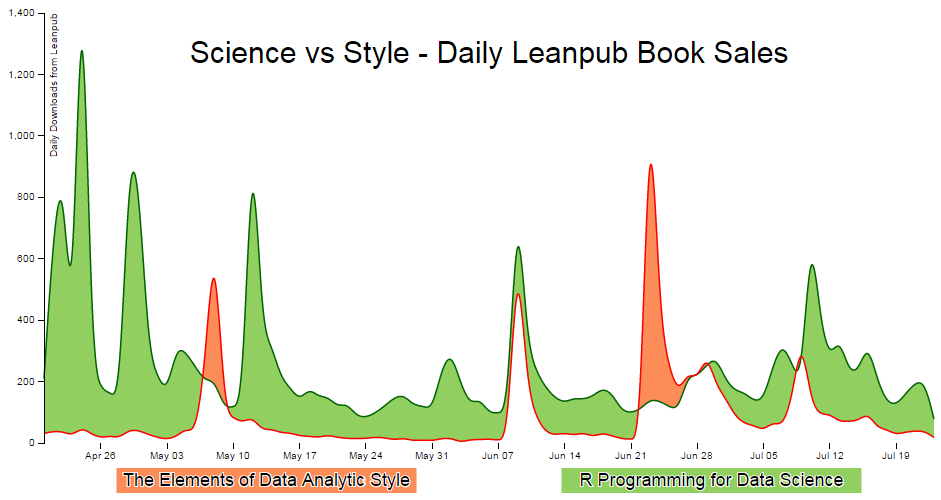
Hi,

That is a great looking chart! We do support some DiffCharts
<https://developers.google.com/chart/interactive/docs/gallery/diffchart>,
but sadly we don't support a Diff Line Chart yet.
That said, there is a way to accomplish it, but it won't be easy. You can
render the area between the two curves using an Area Interval
<https://developers.google.com/chart/interactive/docs/gallery/intervals#area-intervals>.
The data for this interval will have to be generated from your own data by
code that you will write; we don't provide any utilities to make this
easier yet.

You will probably need two Area intervals, one for when the first series is
higher and the other for when the second series is higher, since you want
to render the two areas different colors. You will also need to check for
intersections between the two series, so that you can end one interval and
start another one. Alternatively, you could do this with just one interval,
but then you won't get the dual colors. I'm not sure how big of a
requirement this is for you.

Hopefully this helps!

On Wed, Jan 13, 2016 at 12:50 PM <[email protected]> wrote:

> I'm trying to make a difference chart (example
> <http://3.bp.blogspot.com/-XIhWf7a4QKU/VbQqfxldvkI/AAAAAAAABfQ/hJLTnLXkHUU/s1600/difference-10.png>),
> but I can't seem to figure it out.  Basically, I just want to show two
> curves, and I want to highlight the area between the curves where the color
> of this area depends on which curve is "on top".  Does anyone have any idea
> how to do this?
>
> Thanks!
>
>
> --
> You received this message because you are subscribed to the Google Groups
> "Google Visualization API" group.
> To unsubscribe from this group and stop receiving emails from it, send an
> email to [email protected].
> To post to this group, send email to
> [email protected].
> Visit this group at
> https://groups.google.com/group/google-visualization-api.
> To view this discussion on the web visit
> https://groups.google.com/d/msgid/google-visualization-api/bea14ded-3732-431d-b628-23ec1cc765da%40googlegroups.com
> <https://groups.google.com/d/msgid/google-visualization-api/bea14ded-3732-431d-b628-23ec1cc765da%40googlegroups.com?utm_medium=email&utm_source=footer>
> .
> For more options, visit https://groups.google.com/d/optout.
>
--

[image: unnamed.gif]

•

•

•

•

Sergey Grabkovsky

Software Engineer

Google, Inc

[email protected]

--
You received this message because you are subscribed to the Google Groups
"Google Visualization API" group.
To unsubscribe from this group and stop receiving emails from it, send an email
to [email protected].
To post to this group, send email to [email protected].
Visit this group at https://groups.google.com/group/google-visualization-api.
To view this discussion on the web visit
https://groups.google.com/d/msgid/google-visualization-api/CAEwwup7Dw_pwEnWNOHi3RaCjLL4jrFNQ%3Duvu5na8NPPfW5vO4w%40mail.gmail.com.
For more options, visit https://groups.google.com/d/optout.