Hey guys,

I'm struggling with a problem I have using the google chart API.
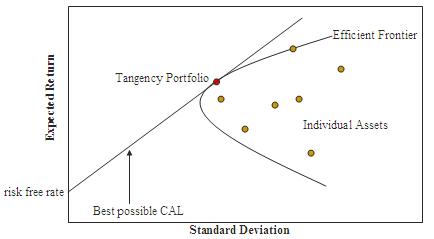
Right now, I'm using a scatter chart to display several points on a
2D-plane and make heavy use of features like annotations and animations.
This works perfectly fine.

My problem is: I want to add a curve into the same chart that is completely
independent from these points. What I mean with this is that this curve is
based on a different data table, so the data points defining the curve have
nothing to do with the points shown in the scatter chart except for the
fact that they are defined on the same axes. We could e.g. have 100 points
in the scatter chart and 3 very different points that define the curve.

Here is a picture of something similar, referring to the single points and
this square-root-like curve:
https://upload.wikimedia.org/wikipedia/commons/e/e1/Markowitz_frontier.jpg

Actually, this leads me to two questions:

   1. Is it possible to add this curve, basically defined by 3 points and
   interpolated by a quadratic function?
   2. Is it possible to make this curve somewhat shallow, so that it is
   ignored when the API resizes the picture to the points in the scatter plot?

I hope my questions is not too confusing ;-)

Thanks!

--
You received this message because you are subscribed to the Google Groups
"Google Visualization API" group.
To unsubscribe from this group and stop receiving emails from it, send an email
to [email protected].
To post to this group, send email to [email protected].
Visit this group at https://groups.google.com/group/google-visualization-api.
To view this discussion on the web visit
https://groups.google.com/d/msgid/google-visualization-api/113ae9fd-8b45-4c46-b51a-63a66296908a%40googlegroups.com.
For more options, visit https://groups.google.com/d/optout.