Thank you Daniel, this works perfectly! The key point was that I should use
null values. Defining a polynomial trendline of degree 2 then does the job.
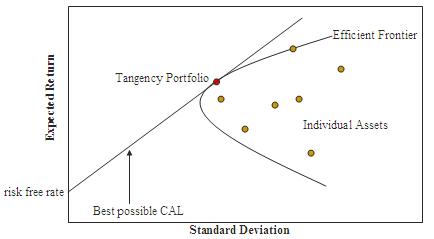
Two questions remain from my side:

   1. As before: Is it possible to make these 3 points
   shallow/invisible/massless (I cannot find the correct word) so that they
   are *not* considered when it comes to resizing the axes? I really rely
   on the default feature of Google graph that it 'zooms' into a smaller
   region that contains all the data points. The quadratic part shall only be
   seen if it is in this viewing area by accident.
   2. Is it possible define a range for trendlines? Right now, I get a
   proper parabola, flipped by 90°. I'm actually only interested in the left
   part of the parabola / the positive part of the square root function.

Thanks again for the great help!

Am Montag, 22. Januar 2018 15:25:11 UTC+1 schrieb Daniel LaLiberte:
>
> Short answer is, yes, you can combine scatter and line charts, but only
> for the classic (non-material) charts.  Look into the combo chart.
> https://developers.google.com/chart/interactive/docs/gallery/combochart
>
> You can use null values in any column where you don't have points or lines
>
> Lines can connect arbitrary points.
>
> You might be able to use the polynomial trendline to interpolate 3 points
> with degree 2 (for quadratic).  You would have to flip the orientation to
> 'vertical' to get the domain on the vertical axis, however.
>
>
>
> On Mon, Jan 22, 2018 at 5:08 AM, mholz <[email protected] <javascript:>>
> wrote:
>
>> Hey guys,
>>
>> I'm struggling with a problem I have using the google chart API.
>>
>> Right now, I'm using a scatter chart to display several points on a
>> 2D-plane and make heavy use of features like annotations and animations.
>> This works perfectly fine.
>>
>> My problem is: I want to add a curve into the same chart that is
>> completely independent from these points. What I mean with this is that
>> this curve is based on a different data table, so the data points defining
>> the curve have nothing to do with the points shown in the scatter chart
>> except for the fact that they are defined on the same axes. We could e.g.
>> have 100 points in the scatter chart and 3 very different points that
>> define the curve.
>>
>> Here is a picture of something similar, referring to the single points
>> and this square-root-like curve:
>> https://upload.wikimedia.org/wikipedia/commons/e/e1/Markowitz_frontier.jpg
>>
>> Actually, this leads me to two questions:
>>
>>    1. Is it possible to add this curve, basically defined by 3 points
>>    and interpolated by a quadratic function?
>>    2. Is it possible to make this curve somewhat shallow, so that it is
>>    ignored when the API resizes the picture to the points in the scatter
>> plot?
>>
>> I hope my questions is not too confusing ;-)
>>
>> Thanks!
>>
>> --
>> You received this message because you are subscribed to the Google Groups
>> "Google Visualization API" group.
>> To unsubscribe from this group and stop receiving emails from it, send an
>> email to [email protected]
>> <javascript:>.
>> To post to this group, send email to [email protected]
>> <javascript:>.
>> Visit this group at
>> https://groups.google.com/group/google-visualization-api.
>> To view this discussion on the web visit
>> https://groups.google.com/d/msgid/google-visualization-api/113ae9fd-8b45-4c46-b51a-63a66296908a%40googlegroups.com
>>
>> <https://groups.google.com/d/msgid/google-visualization-api/113ae9fd-8b45-4c46-b51a-63a66296908a%40googlegroups.com?utm_medium=email&utm_source=footer>
>> .
>> For more options, visit https://groups.google.com/d/optout.
>>
>
>
>
> --
> Daniel LaLiberte <https://plus.google.com/100631381223468223275?prsrc=2>
> [email protected] <javascript:>   5CC, Cambridge MA
>

--
You received this message because you are subscribed to the Google Groups
"Google Visualization API" group.
To unsubscribe from this group and stop receiving emails from it, send an email
to [email protected].
To post to this group, send email to [email protected].
Visit this group at https://groups.google.com/group/google-visualization-api.
To view this discussion on the web visit
https://groups.google.com/d/msgid/google-visualization-api/37a2599f-487e-49a8-84a4-b792c71230d3%40googlegroups.com.
For more options, visit https://groups.google.com/d/optout.