Living in an earthquake area, I understand and appreciate the need for
geological maps. The problem is in the complexity of geological data. Using
OSM as a base layer over which geological data is displayed is a very easy
way to see if residents and office buildings are in danger zones. I've
contemplated a similar solution to map potential landslide areas. I think
these features belong in another database. If we focus on mapping
structures, roads, landuse, basically thing we can see, it will improve the
use of geological overlays.
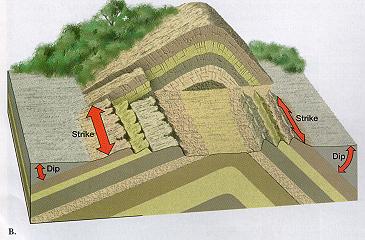
BTW - some faults can be mapped since they are visible from aerial imagery.

Clifford

On Thu, Mar 12, 2015 at 3:03 PM, Hazel <[email protected]> wrote:

> Dear All,
>
> Can we again discuss putting geological data into OSM? Specifically, I'd
> like a recommended way to tag fault lines and surface geology polygons.
>
> This e-mail assumes the reader knows nothing of geology, apologies to
> everyone else.
>
> First, the usecase: geological data saves lives in natural disasters, it
> is useful for common activities like agriculture, and it is interesting in
> its own right. It can also be usefully collected by amateurs.
>
> I am not suggesting that OSM should produce disaster risk maps, or
> recommendations for farmers. I am saying OSM could collect the data that
> would allow experts to quickly and easily make these things.
>
> Using OSM contours, they can work out areas of flood risk and tsunami
> escape routes. Using contours and and basic geological information, they
> can work out areas of landslide risk (landslides kill more people than
> volcanoes or floods or earthquakes, but they kill a few dozen at a time).
> If we map faults, they'll know more about where earthquakes are likely to
> happen (you know the photos of roads after earthquakes, offset by a few
> centimeters? The fault is the plane where the offset happens, and
> earthquakes use the same faults over and over again). If you map areas of
> shallow bedrock vs. unconsolidated sediment, you know which areas may
> suffer soil liquifaction in an earthquake.
>
> https://en.wikipedia.org/wiki/Soil_liquefaction soil liquifaction
>
> Technical infodump:
>
> To make a geological map, you map areas with similar surface rock or
> sediment2. You describe them (anything from field IDs like "greenish rock
> #2" to detailed technical descriptions) and give them proper names (e.g.
> "the Tunbridge Wells Sand Formation").
>
> Having mapped the boundaries between different rock types, you can also
> trace faults and the line of folds in the rocks. These all obviously exist
> in 3-D, but are usually represented on 2-D maps. Just mapping the 2-D trace
> is enough for many purposes.
>
> OPTIONAL EXTRA 3-D info:
> If you want to add more information about the third dimension to a two-D
> map, there are conventions for that. You specify a line (along the axis of
> the fold, or on the steepest line down the fault plane or boundary plane).
> You map the direction of this line. Then you measure the angle between the
> line and the horizontal, and write in on the map (next to standard symbols:
> for a plane, a T-shape, and for a fold axis, an X with two or three of the
> lines turned into arrows pointing in the two or three downhill directions).
>
> Plane:
> http://web.arc.losrios.edu/~borougt/StrikeAndDip.jpg
>
> Fold:
> http://bc.outcrop.org/images/structural/press4e/figure-11-16b.jpg
>
> Planes on either side of a fold:
> http://courses.missouristate.edu/EMantei/creative/GeoStruct/strkdip.jpg
>
> This is actually fairly easy to explain in 3-D, but not in 2-D, and I
> don't know of a good video. We could make one.
> END OPTIONAL EXTRA
>
>
> Example:
> Let's look at the Weald area of the UK, since it is well-mapped.
>
> Read:
> https://en.wikipedia.org/wiki/Weald#Geology
>
> Terms:
> "Lower Cretaceous" and "Upper Jurassic" describe age (lower means older)
> "rocks", "chalk" and "sandstone" describe rock type
> "sands" and "clays" describe sediment type
> "Purbeck Beds", "Ashdown Sand Formation" and so on are proper names of
> groups of rocks/sediments. These names are hierachical, like taxons, and
> are in databases (for the Chalk Group that forms the White Cliffs of Dover:
> http://www.bgs.ac.uk/lexicon/lexicon.cfm?pub=CK).
>
> The cross-section may help make the 2-d map make sense.
>
> To see how faults and folds (synclines/synforms, that sag, and
> anticlines/antiforms, that hog) are mapped as lines, see this map:
> https://commons.wikimedia.org/wiki/File:Geologic_map_SE_
> England_%26_Channel_EN.svg
> (just gives rock ages, not type).
>
> Faults are usually much more obvious on small-scale maps than they are on
> this map.
>
> For sediments, there exist multiple soil classifications, with mappings
> between them, and OSM could support them all, but the classes we have
> (sand, gravel...) would be enough to start with.
> Examples:
> https://en.wikipedia.org/wiki/Australian_Soil_Classification
> https://en.wikipedia.org/wiki/USDA_soil_taxonomy
> etc.
>
> QGIS is increasingly used for geological mapping, so it works increasingly
> well with many other geological tools. QGIS is already well-integrated with
> OSM. The barrier for geologists new to OSM to upload their maps is
> therefore low. Classes of students could do it.
> http://wiki.openstreetmap.org/wiki/QGIS
>
> End infodump, requests for clarification and corrections welcome.
>
> Could anyone suggest a set of minimal changes that would make it possible
> to enter data like this? As I said, just having a recommended way to enter
> a surface geology polygon, a geological contact line (between two
> polygons), and a fault line (with optional dip direction and inclination)
> would be very useful.
>
> Pseudo-3-D perfection would also allow keeners to input the contact
> between two rock formations (line, with dip direction and inclination) and
> input folds (line, with dip inclination), but this can also wait.
>
> Regards,
> Hazel
>
>
> _______________________________________________
> HOT mailing list
> [email protected]
> https://lists.openstreetmap.org/listinfo/hot
>


--
@osm_seattle
osm_seattle.snowandsnow.us
OpenStreetMap: Maps with a human touch
_______________________________________________
HOT mailing list
[email protected]
https://lists.openstreetmap.org/listinfo/hot