Sander,
I agree with most of your points and would like to add that
surface geology is a highly specialized field requiring a great deal
of expertise. I'm a geology buff myself, and there is no way I would
attempt to map that. Also, there often is strong disagreement among
geology professionals about the nature and dating of rock units,
disagreements that make some of our set-tos about how to code sound trivial.
Also, there generally is a lot of local information about
landslides and tsunami risk, courtesy of the USGS, though sometimes
it is ignored. In Los Angeles, tsunami-prone areas are signed along
major roads, as are the areas subject to debris flows. The recent
deadly landslide in Oregon was in an area known to experience
landslides, but apparently the risk was not widely publicized.
Tsunami risk, perhaps, could work as an overlay, and I
believe that data is available from the USGS.
But, generally, I think this whole area may be too technical
for widespread application in OSM, even though I would enjoy seeing it.
Charlotte


At 05:59 AM 3/13/2015, you wrote:
I think this suggestion belongs more on the general OSM talk or
tagging list than on the HOT list, but anyway.
There are already a number of ways to tag surface, like surface=*,
natural=*, landuse=*, landcover=*, ... Just read the wiki about
those (f.e.
<http://wiki.openstreetmap.org/wiki/Key:natural>http://wiki.openstreetmap.org/wiki/Key:natural
)
There's also a convention in OSM about sub-tagging. F.e. you could tag

natural=rock + rock=sandstone
Thus I guess most of what you want is already possible in OSM. You
should only try to add a few more specific conventions (f.e. about
the types of rock).
I probably don't really get your 3D attempts, but the general
concensus is that it's hard to get in certain places, and thus you
can't make a uniform map of heights or angles. As such, OSM contains
no height or slope data (apart from the elevation of some peaks),
but leaves this to professionals (such as the NASA). It isn't so
hard to extract a general slope from good precision elevation data,
so there's no point in including it directly in OSM data (with the
right preprocessor, it can get rendered on the map anyway).
So that doesn't belong in OSM, but it isn't the biggest problem IMO.
The biggest problem I see in your attempt is ignoring that OSM is a
crowdsourced effort. For crowdsourcing, you need a crowd, and that
crowd is most easily found in populated places. Your effort seems to
focus on areas with a low population (a city isn't very vulnerable
for a landslide). But sadly, there's no crowd around there, so the
most we would be able to do is some mapping from aerial pictures.
This shouldn't hinder you from starting the project, but you
shouldn't have very high expectations from it.
Regards,
Sander


2015-03-12 22:03 GMT+01:00 Hazel <<mailto:[email protected]>[email protected]>:
Dear All,
Can we again discuss putting geological data into OSM? Specifically,
I'd like a recommended way to tag fault lines and surface geology polygons.
This e-mail assumes the reader knows nothing of geology, apologies
to everyone else.
First, the usecase: geological data saves lives in natural
disasters, it is useful for common activities like agriculture, and
it is interesting in its own right. It can also be usefully
collected by amateurs.
I am not suggesting that OSM should produce disaster risk maps, or
recommendations for farmers. I am saying OSM could collect the data
that would allow experts to quickly and easily make these things.
Using OSM contours, they can work out areas of flood risk and
tsunami escape routes. Using contours and and basic geological
information, they can work out areas of landslide risk (landslides
kill more people than volcanoes or floods or earthquakes, but they
kill a few dozen at a time). If we map faults, they'll know more
about where earthquakes are likely to happen (you know the photos of
roads after earthquakes, offset by a few centimeters? The fault is
the plane where the offset happens, and earthquakes use the same
faults over and over again). If you map areas of shallow bedrock vs.
unconsolidated sediment, you know which areas may suffer soil
liquifaction in an earthquake.
<https://en.wikipedia.org/wiki/Soil_liquefaction>https://en.wikipedia.org/wiki/Soil_liquefaction
soil liquifaction
Technical infodump:
To make a geological map, you map areas with similar surface rock or
sediment2. You describe them (anything from field IDs like "greenish
rock #2" to detailed technical descriptions) and give them proper
names (e.g. "the Tunbridge Wells Sand Formation").
Having mapped the boundaries between different rock types, you can
also trace faults and the line of folds in the rocks. These all
obviously exist in 3-D, but are usually represented on 2-D maps.
Just mapping the 2-D trace is enough for many purposes.
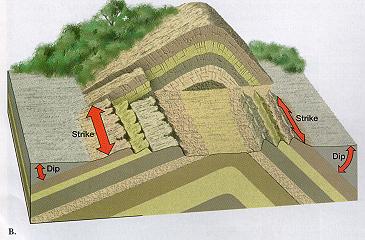
OPTIONAL EXTRA 3-D info:
If you want to add more information about the third dimension to a
two-D map, there are conventions for that. You specify a line (along
the axis of the fold, or on the steepest line down the fault plane
or boundary plane). You map the direction of this line. Then you
measure the angle between the line and the horizontal, and write in
on the map (next to standard symbols: for a plane, a T-shape, and
for a fold axis, an X with two or three of the lines turned into
arrows pointing in the two or three downhill directions).
Plane:
<http://web.arc.losrios.edu/~borougt/StrikeAndDip.jpg>http://web.arc.losrios.edu/~borougt/StrikeAndDip.jpg

Fold:
<http://bc.outcrop.org/images/structural/press4e/figure-11-16b.jpg>http://bc.outcrop.org/images/structural/press4e/figure-11-16b.jpg

Planes on either side of a fold:
<http://courses.missouristate.edu/EMantei/creative/GeoStruct/strkdip.jpg>http://courses.missouristate.edu/EMantei/creative/GeoStruct/strkdip.jpg
This is actually fairly easy to explain in 3-D, but not in 2-D, and
I don't know of a good video. We could make one.
END OPTIONAL EXTRA


Example:
Let's look at the Weald area of the UK, since it is well-mapped.

Read:
<https://en.wikipedia.org/wiki/Weald#Geology>https://en.wikipedia.org/wiki/Weald#Geology

Terms:
"Lower Cretaceous" and "Upper Jurassic" describe age (lower means older)
"rocks", "chalk" and "sandstone" describe rock type
"sands" and "clays" describe sediment type
"Purbeck Beds", "Ashdown Sand Formation" and so on are proper names
of groups of rocks/sediments. These names are hierachical, like
taxons, and are in databases (for the Chalk Group that forms the
White Cliffs of Dover:
<http://www.bgs.ac.uk/lexicon/lexicon.cfm?pub=CK>http://www.bgs.ac.uk/lexicon/lexicon.cfm?pub=CK).
The cross-section may help make the 2-d map make sense.
To see how faults and folds (synclines/synforms, that sag, and
anticlines/antiforms, that hog) are mapped as lines, see this map:
<https://commons.wikimedia.org/wiki/File:Geologic_map_SE_England_%26_Channel_EN.svg>https://commons.wikimedia.org/wiki/File:Geologic_map_SE_England_%26_Channel_EN.svg
(just gives rock ages, not type).
Faults are usually much more obvious on small-scale maps than they
are on this map.
For sediments, there exist multiple soil classifications, with
mappings between them, and OSM could support them all, but the
classes we have (sand, gravel...) would be enough to start with.
Examples:
<https://en.wikipedia.org/wiki/Australian_Soil_Classification>https://en.wikipedia.org/wiki/Australian_Soil_Classification
https://en.wikipedia.org/wiki/USDA_soil_taxonomy
etc.
QGIS is increasingly used for geological mapping, so it works
increasingly well with many other geological tools. QGIS is already
well-integrated with OSM. The barrier for geologists new to OSM to
upload their maps is therefore low. Classes of students could do it.
<http://wiki.openstreetmap.org/wiki/QGIS>http://wiki.openstreetmap.org/wiki/QGIS

End infodump, requests for clarification and corrections welcome.
Could anyone suggest a set of minimal changes that would make it
possible to enter data like this? As I said, just having a
recommended way to enter a surface geology polygon, a geological
contact line (between two polygons), and a fault line (with optional
dip direction and inclination) would be very useful.
Pseudo-3-D perfection would also allow keeners to input the contact
between two rock formations (line, with dip direction and
inclination) and input folds (line, with dip inclination), but this
can also wait.
Regards,
Hazel


_______________________________________________
HOT mailing list
<mailto:[email protected]>[email protected]
https://lists.openstreetmap.org/listinfo/hot
_______________________________________________ HOT mailing list
[email protected] https://lists.openstreetmap.org/listinfo/hot
Charlotte Wolter
927 18th Street Suite A
Santa Monica, California
90403
+1-310-597-4040
[email protected]
Skype: thetechlady
_______________________________________________
HOT mailing list
[email protected]
https://lists.openstreetmap.org/listinfo/hot