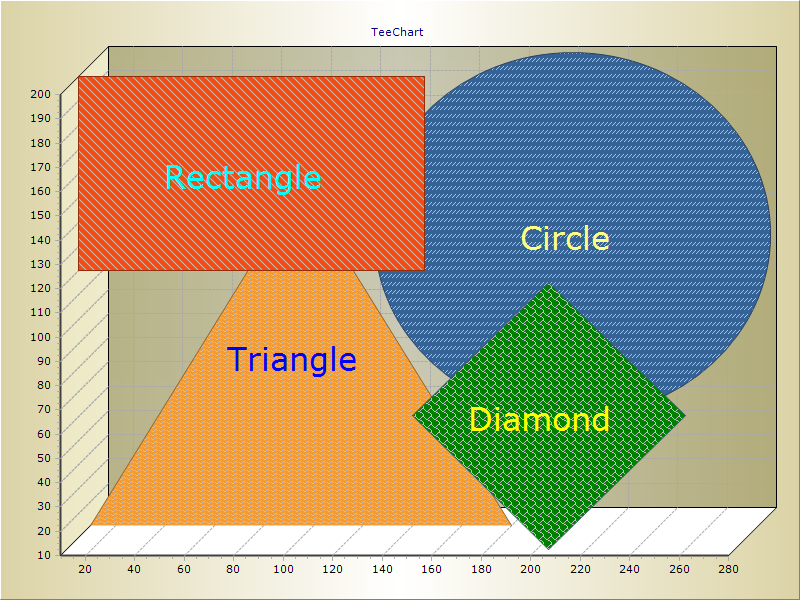
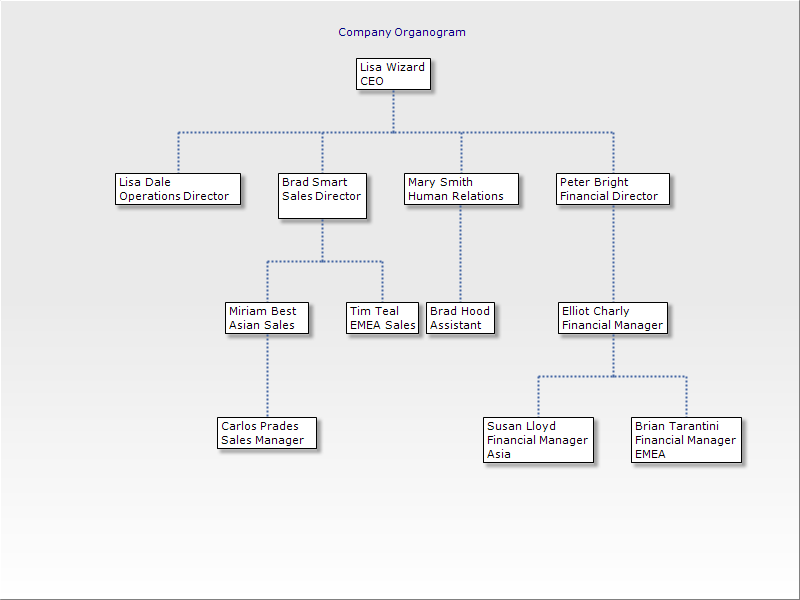
Am Mittwoch, den 20.04.2011, 14:09 +0200 schrieb Michael Van Canneyt:
>
> On Wed, 20 Apr 2011, Alexander Klenin wrote:
>
> > On Wed, Apr 20, 2011 at 21:56,  <[email protected]> wrote:
> >>> Our class design is way to large to fit on any paper our printers can
> >>> handle, or what can even be displayed on a single screen. So we have to
> >>> segment our UML class diagrams to specific areas of our product - only
> >>> showing the classes in question. eg: Account Invoicing, Learner
> >>> Registration, etc.  Anything larger and it is information overload!
> >>>
> >>> So your idea of selecting what classes to diagram is vital.
> >>
> >> All this possible with fpclasschart. I added a graphviz backend to it a
> >> couple of months ago. Graphviz will do the automatic layout.
> >
> > I have a long-term plan to add shapes to TAChart, to support these
> > kinds of TeeChart diagrams:
> > http://www.steema.com/uploads/gallery/shape.png
> > http://www.steema.com/uploads/gallery/organizational1.png
> >
> > With proper modularization, they can be used to draw class diagrams
> > independently of other TAChart functionality.
> > In particular, I hope that data from CodeTools can be used
> > for on-line diagram building from IDE.
>
> Isn't drawing of diagrams a bit far-fetched for a charting component ?
> I mean, I can use a screw-driver as a hammer, but this is not really its
> purpose, and definitely not the best tool for the job ?
>
> I can see it as part of a larger 2-D graphics suite, of course.
There is at least aggpas, although I don't know if it is compilable
using fpc.

And there has been another graphics and shape drawing core with demo
apps by a guy named Angus, the rest (family name, project name, link) I
forgot and cannot find anymore ...

--
Marc Santhoff <[email protected]>


--
_______________________________________________
Lazarus mailing list
[email protected]
http://lists.lazarus.freepascal.org/mailman/listinfo/lazarus