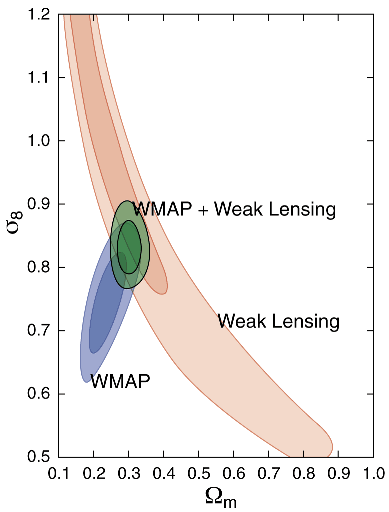
I have a function on a 2d grid that looks like a skewed mound.  I
would like to make a contour plot where each contour represents each
sigma, or confidence interval.
I.e. Is there a straight forward way to make such a contour plot where
it is then easy to say:  This line is 1-sigma or 68% confidence
interval, this line is 95% confidence interval, etc...

Such plots look like this:
http://lambda.gsfc.nasa.gov/product/map/current/pub_papers/threeyear/parameters/images/Med/ds_f07_PPT_M.png
 where the first region of each graph is the on sigma or 68%
confidence interval and the second line is the 95% confidence
interval.

Thanks.

                Joseph Smidt

--
------------------------------------------------------------------------
Joseph Smidt <[email protected]>

Physics and Astronomy
4129 Frederick Reines Hall
Irvine, CA 92697-4575
Office: 949-824-3269

------------------------------------------------------------------------------
Let Crystal Reports handle the reporting - Free Crystal Reports 2008 30-Day
trial. Simplify your report design, integration and deployment - and focus on
what you do best, core application coding. Discover what's new with
Crystal Reports now.  http://p.sf.net/sfu/bobj-july
_______________________________________________
Matplotlib-users mailing list
[email protected]
https://lists.sourceforge.net/lists/listinfo/matplotlib-users