I'm using matplotlib from pylab to generate eye patterns for signal
simulations. My output pretty much looks like this:
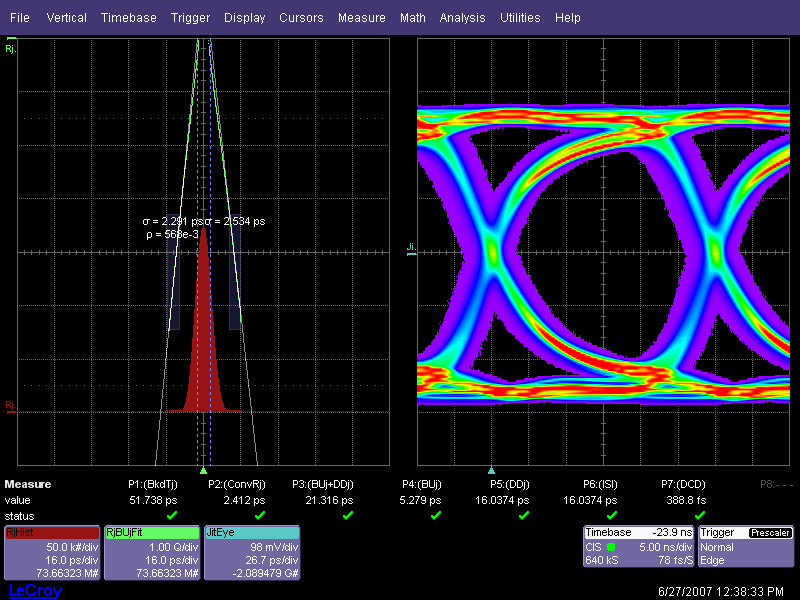
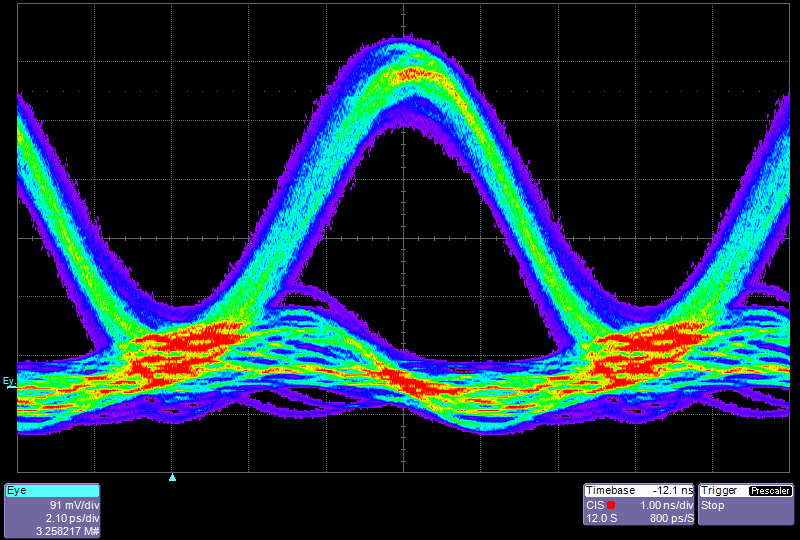
http://www.flickr.com/photos/31208937@N06/6079131690/

Its pretty useful as it allows one to quickly see the size of the eye
opening, the maximum/minimum voltage, etc. I'd really like to be able
to create a heat diagram, like these:

http://www.lecroy.com/images/oscilloscope/series/waveexpert/opening-spread2_lg.jpg
http://www.lecroy.com/images/oscilloscope/series/waveexpert/opening-spread1_lg.jpg
http://www.iec.org/newsletter/august07_2/imgs/bb2_fig_1.gif
http://www.altera.com/devices/fpga/stratix-fpgas/stratix-ii/stratix-ii-gx/images/s2gx-rollout-6g-eye.jpg

Is there any way within matplotlib to do that right now?

------------------------------------------------------------------------------
Try before you buy = See our experts in action!
The most comprehensive online learning library for Microsoft developers
is just $99.99! Visual Studio, SharePoint, SQL - plus HTML5, CSS3, MVC3,
Metro Style Apps, more. Free future releases when you subscribe now!
http://p.sf.net/sfu/learndevnow-dev2
_______________________________________________
Matplotlib-users mailing list
[email protected]
https://lists.sourceforge.net/lists/listinfo/matplotlib-users