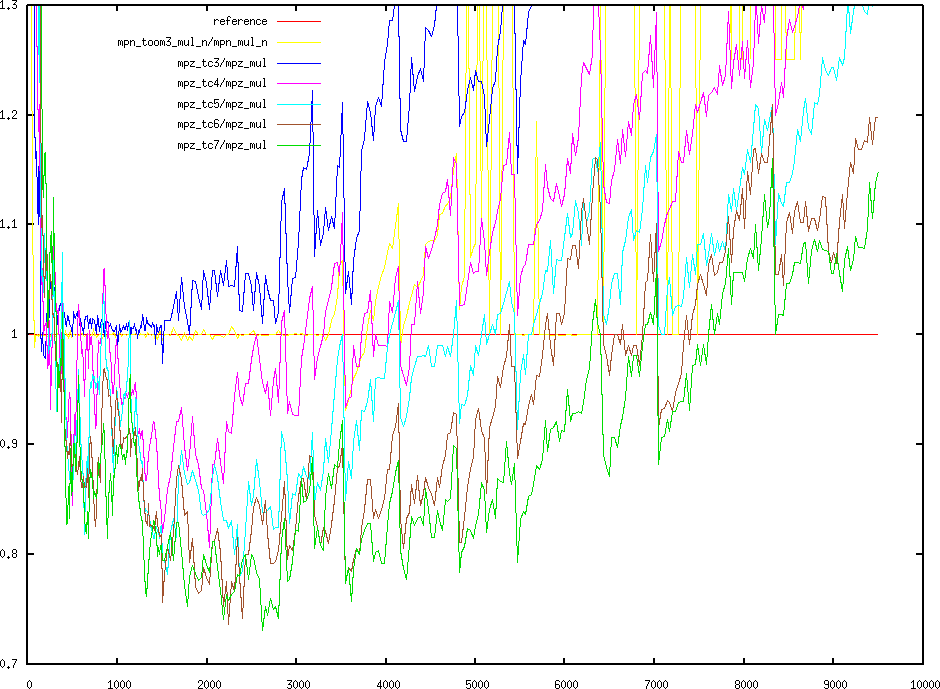
Clicking on the graph does make it bigger, but yeah, the critical
region we are talking about is a bit compressed.
Bill.

2009/4/15 David Harvey <[email protected]>:
>
>
> On Apr 15, 6:08 pm, Bill Hart <[email protected]> wrote:
>> It's a bit hard to see the graph, but you see a similar phenomenon
>> with the cutoffs on Bodrato's graph:
>>
>> http://bodrato.it/software/tc3-7-percent.png
>>
>> Toom 7 looks to be ahead of Toom 4 from a very early point.
>
> Sorry mate, I can't quite see it, my screen doesn't have enough
> pixels.
>
> david
>
> >
>

--~--~---------~--~----~------------~-------~--~----~
You received this message because you are subscribed to the Google Groups
"mpir-devel" group.
To post to this group, send email to [email protected]
To unsubscribe from this group, send email to
[email protected]
For more options, visit this group at
http://groups.google.com/group/mpir-devel?hl=en
-~----------~----~----~----~------~----~------~--~---