Wang-Yong2018 opened a new issue #13313:
URL: https://github.com/apache/superset/issues/13313
A clear and concise description of what the bug is. ### Expected results what you expected to happen. Like superset0.3X version, the eventflow chart could show chart based on entity column and event column based on the datetime columns. For example, the examples dataset wb_health_population can show eventflow. The input ( datasource = wb_health_population chart type = event flow timecolumn = year entity= country_code event= region The screen capture is below: 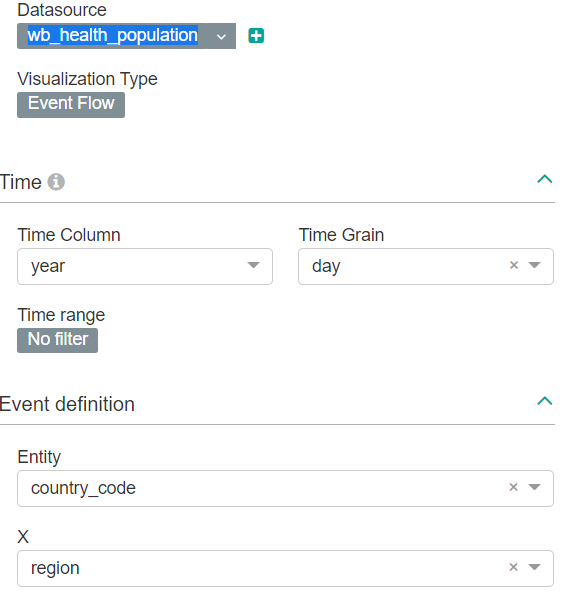 The output the X axis is time gap , the Y axis is the grouped country_code  ### Actual results what actually happens. After I upgraded to superset v1.0.1, the eventflow coould not work and report sql error info as below #### Screenshots If applicable, add screenshots to help explain your problem.  #### How to reproduce the bug 1. Go to 'charts' 2. Click on '+chart' to goto "Create new chart" page 3. In the "Create new chart" page, click "choose a dataset", 4. Scroll down to 'wb_health_population' 4. At visualize type, click "table" and switch to "Event Flow" by scrow down 5. click "create new chart" and wait page loading 6. In the loaded page, click "time range" and select "no filter" in timerange select and click apply 7. At entity column, scroll down and select "country_code" 8. at event column, scrool down and select "region" column 9. client "run" 10. Error log is below ``` PostgreSQL Error column "wb_health_population.region" must appear in the GROUP BY clause or be used in an aggregate function LINE 1: SELECT region AS region, ``` ### Environment Docker Environment amancevice/superset :1.0.1 (please complete the following information): - superset version: `superset version` ``` -=-=-=-=-=-=-=-=-=-=-=-=-=-=-= Superset 1.0.1 -=-=-=-=-=-=-=-=-=-=-=-=-=-=-= ``` - python version: `python --version` `Python 3.8.7` - node.js version: `node -v` `bash: node: command not found` ### Checklist Make sure to follow these steps before submitting your issue - thank you! - [ X] I have checked the superset logs for python stacktraces and included it here as text if there are any. ``` superset_1 | WARNING:superset.connectors.sqla.models:Query SELECT region AS region, superset_1 | country_code AS country_code, superset_1 | year AS __timestamp superset_1 | FROM wb_health_population superset_1 | GROUP BY year superset_1 | ORDER BY country_code ASC superset_1 | LIMIT 10000 on schema None failed superset_1 | Traceback (most recent call last): superset_1 | File "/usr/local/lib/python3.8/site-packages/superset/connectors/sqla/models.py", line 1321, in query superset_1 | df = self.database.get_df(sql, self.schema, mutator) superset_1 | File "/usr/local/lib/python3.8/site-packages/superset/models/core.py", line 390, in get_df superset_1 | self.db_engine_spec.execute(cursor, sqls[-1]) superset_1 | File "/usr/local/lib/python3.8/site-packages/superset/db_engine_specs/base.py", line 909, in execute superset_1 | cursor.execute(query) superset_1 | psycopg2.errors.GroupingError: column "wb_health_population.region" must appear in the GROUP BY clause or be used in an aggregate function superset_1 | LINE 1: SELECT region AS region, superset_1 | ^ superset_1 | ``` - [X ] I have reproduced the issue with at least the latest released version of superset. - [X ] I have checked the issue tracker for the same issue and I haven't found one similar. ### Additional context Add any other context about the problem here. After compared with previously superset v0.34 or v0.36, and the chart query by click "view query" in chart page. I noticed the issue was generated by wrong sql of the chart in V1.0.1 In superset v0.34 or v0.36, the correct sql is below: ``` SELECT region AS region, country_code AS country_code, DATE(year) AS __timestamp FROM wb_health_population ORDER BY country_code ASC LIMIT 50000 ``` As eventflow chart only need trunc time column to selected time grain. But in superset v1.0.1, the eventflow chart sql is just group by the time column to selected time grain. Let's the reason missing columns. The wrong sql is below: ``` SELECT region AS region, country_code AS country_code, year AS __timestamp FROM wb_health_population GROUP BY year ORDER BY country_code ASC LIMIT 50000; ``` If the event flow chart can call similar sql generation function as v0.3x, the problem might be solved. Looking foward anyone could support on it. Or advice me which part of code is related to event chart sql generated, I can fixed and fixed the bug. ---------------------------------------------------------------- This is an automated message from the Apache Git Service. To respond to the message, please log on to GitHub and use the URL above to go to the specific comment. For queries about this service, please contact Infrastructure at: [email protected] --------------------------------------------------------------------- To unsubscribe, e-mail: [email protected] For additional commands, e-mail: [email protected]