Hi y'all,
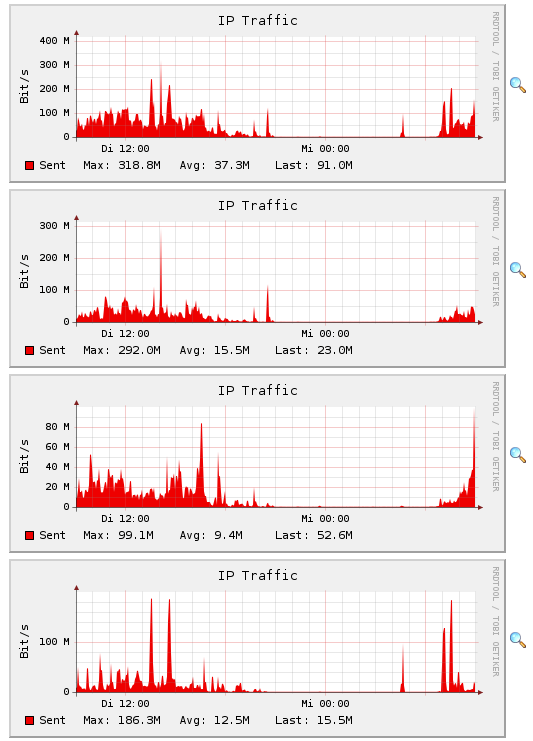
i have a question regarding the historical data view. Please see the pic at
http://www.thovo.de/bilder/ntop.png , could you explain why there are four
different graphs for "IP-Traffic" with different througputs but no further
explanation? I wonder what information i can get from those....


Thanks in advance and best regards,
  Thorsten


---------
Dipl.-Ing.
Thorsten Volkmer-Wolf
IT-Support & Services

AEROTEC Engineering GmbH
Hein-Saß-Weg 38
21129 Hamburg / Germany

fon +49 (0)40/742 198-241
fax +49 (0)40/742 198-111
http://www.aerotec.de

Geschäftsführer: Jürgen Hoffmann, Rainer Feddersen, Amtsgericht Itzehoe HRB
1512
_______________________________________________
Ntop mailing list
[email protected]
http://listgateway.unipi.it/mailman/listinfo/ntop