What's the URL you're using?  In other words, what links are you following to
get here.  I THINK I know, but it looks like your graphs aren't the same as
mine.
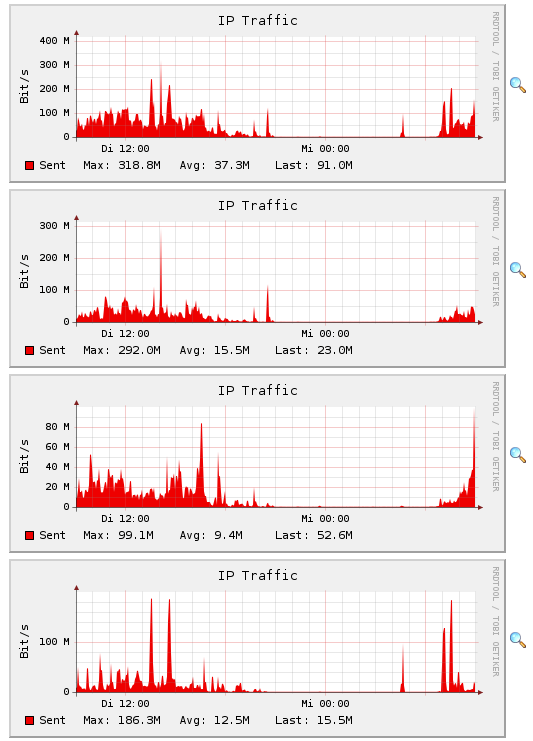
Also, I noticed the data in historical views doesn't seem all that accurate.
I'm double checking this - but so far it's off by 8 - 10 times the "real" data.

Gary


-----Original Message-----
From: [EMAIL PROTECTED] [mailto:[EMAIL PROTECTED] On Behalf Of Thorsten
Volkmer-Wolf
Sent: Monday, October 29, 2007 3:16 AM
To: [email protected]
Subject: [Ntop] a question to 3.3.3 historical view graphs

Hi y'all,


i have a question regarding the historical data view. Please see the pic at
http://www.thovo.de/bilder/ntop.png , could you explain why there are four
different graphs for "IP-Traffic" with different througputs but no further
explanation? I wonder what information i can get from those....


Thanks in advance and best regards,
  Thorsten


---------
Dipl.-Ing.
Thorsten Volkmer-Wolf
IT-Support & Services

AEROTEC Engineering GmbH
Hein-Saß-Weg 38
21129 Hamburg / Germany

fon +49 (0)40/742 198-241
fax +49 (0)40/742 198-111
http://www.aerotec.de

Geschäftsführer: Jürgen Hoffmann, Rainer Feddersen, Amtsgericht Itzehoe HRB
1512
_______________________________________________
Ntop mailing list
[email protected]
http://listgateway.unipi.it/mailman/listinfo/ntop

===========================================================================


"This email is intended to be reviewed by only the intended recipient
 and may contain information that is privileged and/or confidential.
 If you are not the intended recipient, you are hereby notified that
 any review, use, dissemination, disclosure or copying of this email
 and its attachments, if any, is strictly prohibited.  If you have
 received this email in error, please immediately notify the sender by
 return email and delete this email from your system."

_______________________________________________
Ntop mailing list
[email protected]
http://listgateway.unipi.it/mailman/listinfo/ntop