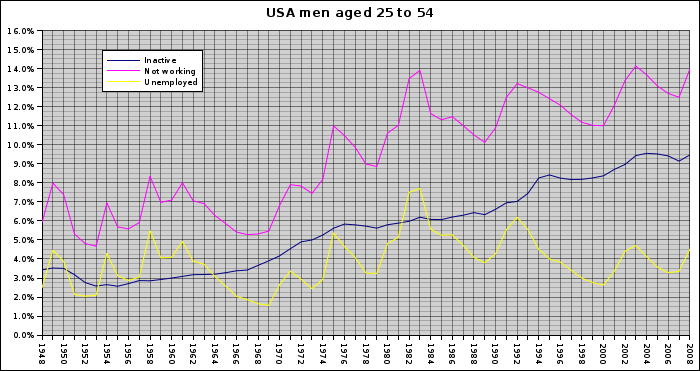
The graph showing the inactive raising
linearly from 3% in 1948 to above 9% in 2008.
http://guerby.org/images/bls-usa-men-25-54.png

Laurent

On Fri, 2009-01-23 at 23:31 +0100, Laurent GUERBY wrote:
> On Wed, 2009-01-21 at 14:54 -0800, Jim Devine wrote:
> > Below, David Leonhardt prevents a more complete unemployment rate for
> > the present which is "above 13 percent" and contrasts it to a
> > similarly-calculated number for 1982 of 16.3 percent. [...]
>
> For male 25-54 in 1982 employed/civilian...population was 86.5% and
> "unemployment" was 7.5%
>
> In 2008 those numbers are 86.0% and 4.5%.
>
> It speaks a lot about the meaningless "unemployment" number.
>
> Back to real numbers: employed/population was above 89% from 1948 to
> 1981 peaking at 95.3% in 1953. Then it was under 89%
> reaching three time a low in 1982, 2003 (85.9%) and 2008.
> If we factor in the carceral population trend we're probably below 1982.
>
> If you graph 1948-2008, unemployment is very noisy
> around a long term average of about 4%, while employment/population
> displays a clear trend downwards starting at 94% with a floor at
> around 86% we've tested three times in the past decades.
>
> For those interested in raw monthly data:
>
> http://guerby.org/ftp/bls-men-25-54.xls
>
> I used the "annual" columns for the numbers above.
>
> Data comes from http://www.bls.gov/data/#employment
> click on "Labor Force Statistics" ONE-SCREEN DATA SEARCH.
>
> Laurent
>

_______________________________________________
pen-l mailing list
[email protected]
https://lists.csuchico.edu/mailman/listinfo/pen-l