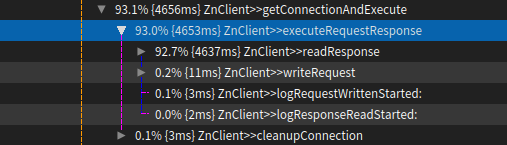
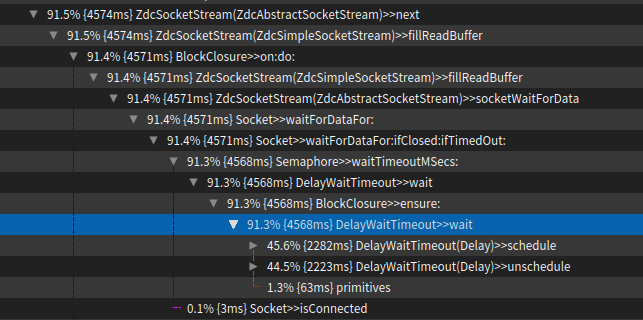
Sven Van Caekenberghe-2 wrote
> Hi,
>
> While benchmarking ZnClient I encountered something weird and counter
> intuitive that I cannot explain.
>
> This was on macOS running Pharo 7 and 6.
>
> First you need to setup a fast local HTTP server, can be anything, for
> example:
>
> $ brew install nginx
> $ brew services start nginx
> $ curl http://localhost:8080
>
> In Pharo, the benchmark code looks as follows:
>
> ZnClient new in: [ :client |
>   [ client get: 'http://localhost:8080' ] bench ].
>
> On my machine this gives about 2500 req/s.
>
> ZnClient uses object logging: it emits special event objects that contain
> information regarding what happens (full details and timing information)
> using an Announcer. Subscribers can then decide what to do with this
> detailed information. This mechanism is always active, but there is an
> option to turn it totally off for maximum performance:
>
> ZnClient new in: [ :client |
>   client loggingOff.
>   [ client get: 'http://localhost:8080' ] bench ].
>
> This gives about 3000 req/s, a non-trivial + 500 req/s improvement.
>
> Now comes the weird thing. GT contains a custom view for Announcers,
> inspect:
>
>   ZnLogEvent announcer.
>
> And select the Announcements tab. Leave this window open.
>
> Now, the first expression (with full logging enabled and an active
> subscriber with a UI) is way FASTER than first, it yields about 7000 to
> 8000 req/s. Since the benchmark runs in the main UI thread, no actual
> drawing happens until the expression finishes.
>
> Running both expression inside a Time profiler show how in the first case
> significant time (actually *most* time ;-) is spent in the logging:
>
>
>
> In the second case, with logging disabled, that changes to:
>
>
>
> One has to take into account that the request has to be processed by the
> server, so from the client's perspective, most time will always be spent
> waiting for a reply, #readResponse. With the logging enabled, probably
> less time is spent waiting, since the client does a bit more work. Still
> what should be slower is more than 2 times as fast !
>
> I have a feeling that this has to do with scheduling (probably interacting
> with network IO), as going deep into the last #readResponse above, I see:
>
>
>
> But I still cannot understand why doing apparently more work results in
> faster throughput.
>
> Can anyone explain this behaviour ?
>
> Thx,
>
> Sven
>
>
>
> Screen Shot 2017-12-10 at 16.59.36.png (68K)
> <http://forum.world.st/attachment/5060328/0/Screen%20Shot%202017-12-10%20at%2016.59.36.png>
> Screen Shot 2017-12-10 at 17.00.28.png (60K)
> <http://forum.world.st/attachment/5060328/1/Screen%20Shot%202017-12-10%20at%2017.00.28.png>
> Screen Shot 2017-12-10 at 17.07.39.png (140K)
> <http://forum.world.st/attachment/5060328/2/Screen%20Shot%202017-12-10%20at%2017.07.39.png>
Just a theory, but iirc, if the vm heartbeat thread isn't running properly,
newly arrived external events only gets checked every N executed bytecodes.
Could explain an increase in delay times before the socket semaphore is
signalled.
Should be easily testable, any low-priority thread with an infinite loop
would probably do enough work.

Cheers,
Henry


--
Sent from: http://forum.world.st/Pharo-Smalltalk-Developers-f1294837.html