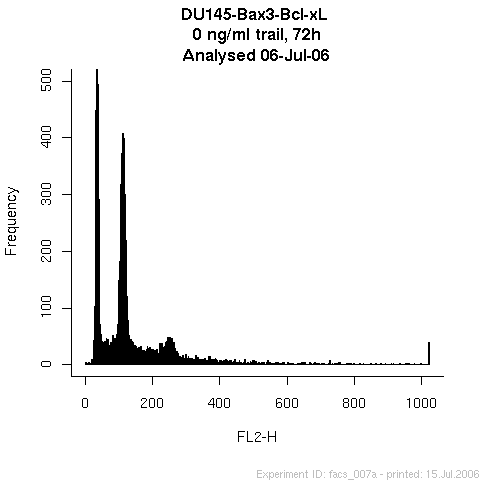
Hello list!

I would like to fit a distribution to each of the peaks in a histogram, such
as this: http://photos1.blogger.com/blogger/7029/2724/1600/DU145-Bax3-Bcl-xL.png
.
The peaks are identified using Petr Pikal peaks function (
http://finzi.psych.upenn.edu/R/Rhelp02a/archive/33097.html), but after that
I am quite stuck.

Any idea as to how I can:
Fit a distribution to each peak
Integrate the area between each two peaks, using the means and widths of the
distributions fitted to the two peaks. I will be using the integrate
function

The histogram is based on approximately 15000 events, which makes Mclust and
pam (which both delivers the information I need) less useful.

The whole point of this exercise is to find the percentage of cells in peak
1, 2, 3, and so on, and between peak 1-2, peak 2-3, peak 3-4 and so on.
Having more that 6 peaks does not appears likely.

I am quite new to R and apologise if the solution is fairly basic.

Thank you in advance for any help and suggestions

Sincerely,
Ulrik

        [[alternative HTML version deleted]]

______________________________________________
[email protected] mailing list
https://stat.ethz.ch/mailman/listinfo/r-help
PLEASE do read the posting guide http://www.R-project.org/posting-guide.html
and provide commented, minimal, self-contained, reproducible code.