ForVic opened a new pull request, #58974:
URL: https://github.com/apache/spark/pull/58974
### What changes were proposed in this pull request? Avoid scanning healthy executor pods in `ExecutorPodsLifecycleManager.onNewSnapshots()`. Like #54759, this targets repeated traversal of heavily overlapping pod snapshots. For a batch of 100 watch updates with 10,000 resident pods, the lifecycle manager currently scans the full pod map twice per snapshot, even when all pods are healthy. This patch maintains a `lifecyclePods` index of terminal and inactive pods alongside the complete snapshot. Watch updates maintain the index incrementally; full lists rebuild it. Failure counting and lifecycle handling traverse the index, while missing-executor reconciliation still uses the complete pod map. Unlike the allocator aggregation in #54759, lifecycle processing must visit every snapshot: a failure can disappear in a later deletion or relist. Terminal pods also stay indexed across unrelated updates so cleanup retries continue. The patch preserves both behaviors. It also skips removal from an empty pending-inactivation set, avoiding repeated boxed executor IDs when retained inactive pods are revisited. ### Why are the changes needed? This reduces driver work after watch updates, especially when most executor pods are healthy. As discussed in #54759, snapshot processing and serial Kubernetes API calls are separate costs; this change addresses the former. Local measurements include **incremental snapshot construction plus lifecycle callback elapsed time**, so index maintenance is included: | 10,000 resident pods, 100 updates per batch | Before | After | | --- | ---: | ---: | | Healthy pods | 14.896 ms | 0.011 ms | | 50% retained inactive | 29.697 ms | 11.670 ms | | 100% retained inactive | 39.378 ms | 29.084 ms | 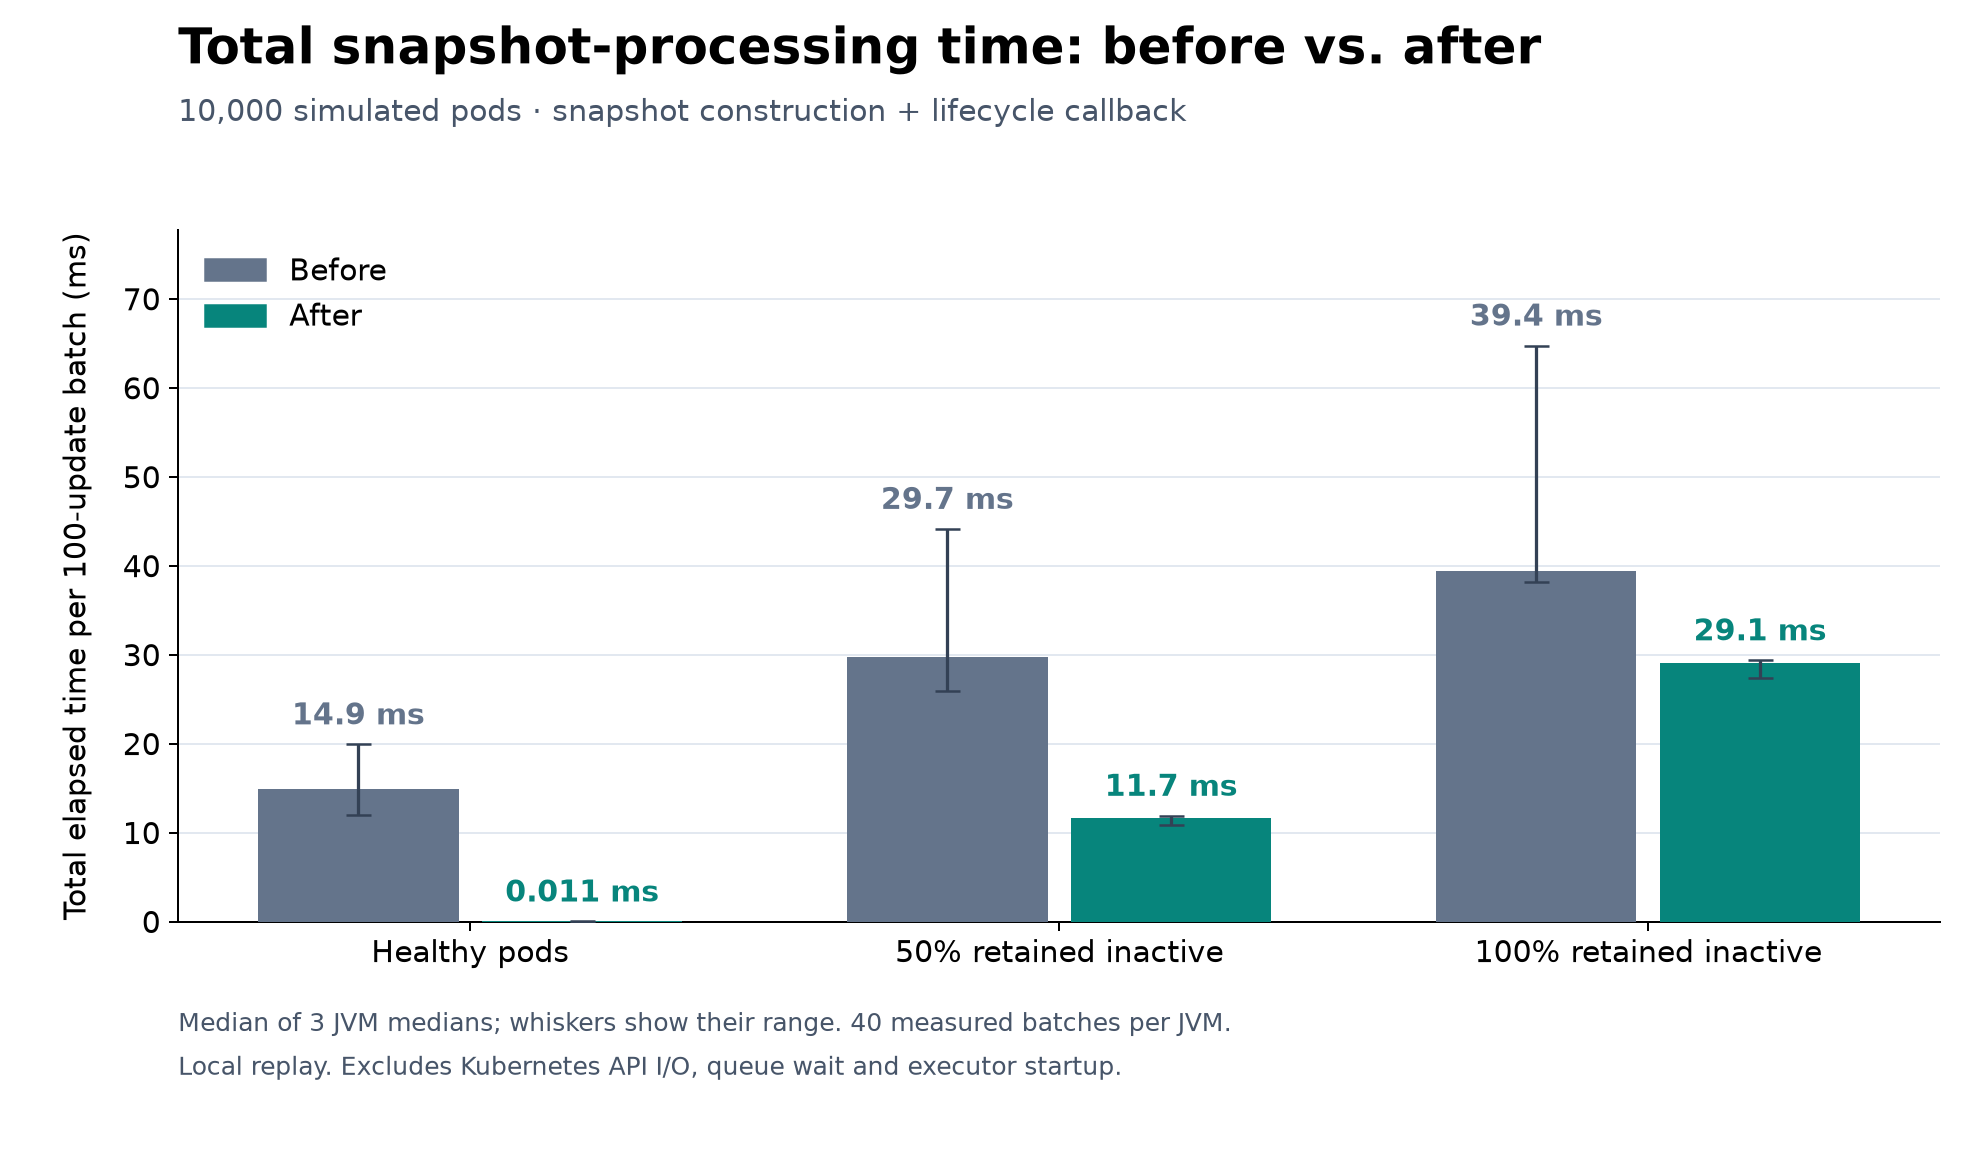 These are medians of three JVM medians, with 40 measured batches per JVM after at least five seconds and 20 warmup batches. Whiskers show the range of JVM medians, not confidence intervals. Hardware: Apple M5 Pro, 48 GiB RAM, macOS 26.4; JDK 17.0.20.1, fixed 1 GiB heap. Both versions use the same harness bytecode and dependencies, swapping the Kubernetes production jar. Baseline is `203017c434785baf66fb6bb00805520c350cc6dc`. The healthy case avoids almost all lifecycle traversal. Retained inactive pods still require traversal, and part of their improvement comes from the empty-set guard. The measurements exclude pod fixture construction, API transport, callback queue wait and executor startup. They are not application end-to-end speedups. ### Does this PR introduce _any_ user-facing change? No. No configuration or intended lifecycle behavior changes. ### How was this patch tested? **49 tests passed** across the snapshot, lifecycle manager, snapshots store and allocator suites; production and test Scala style checks passed. ```sh build/sbt -Pkubernetes \ 'kubernetes/testOnly *ExecutorPodsSnapshotSuite *ExecutorPodsLifecycleManagerSuite *ExecutorPodsSnapshotsStoreSuite *ExecutorPodsAllocatorSuite' \ 'kubernetes/Compile/scalastyle' \ 'kubernetes/Test/scalastyle' ``` Focused regression coverage checks index updates and replacement, inactive-label changes, failures followed by deletion/relisting in the same batch, cleanup retries after unrelated healthy updates, and healthy registered executors remaining visible to missing-pod reconciliation. Supplemental local replays use the real allocator, lifecycle manager and threaded snapshots store, with mocked Kubernetes calls and scheduler backend. They exercise grow/shrink/regrow, relisting after a missed watch event, missing-pod reconciliation, cleanup failures/retries and delayed inactive-label acknowledgements. - Four deterministic before/after scenarios match all 411 recorded baseline actions, including arguments and executor-removal reasons. Comparison ignores ordering between independent pods. - All 18 threaded 1,000-pod runs pass final-state assertions. - Whole-replay median elapsed times are 3.559 -> 3.415 s for normal deletion, 7.899 -> 8.053 s for delayed deletion, and 4.809 -> 4.626 s for delayed retention. Delayed-delete ranges overlap. These modest, mixed results reflect event pacing and blocking stub calls. 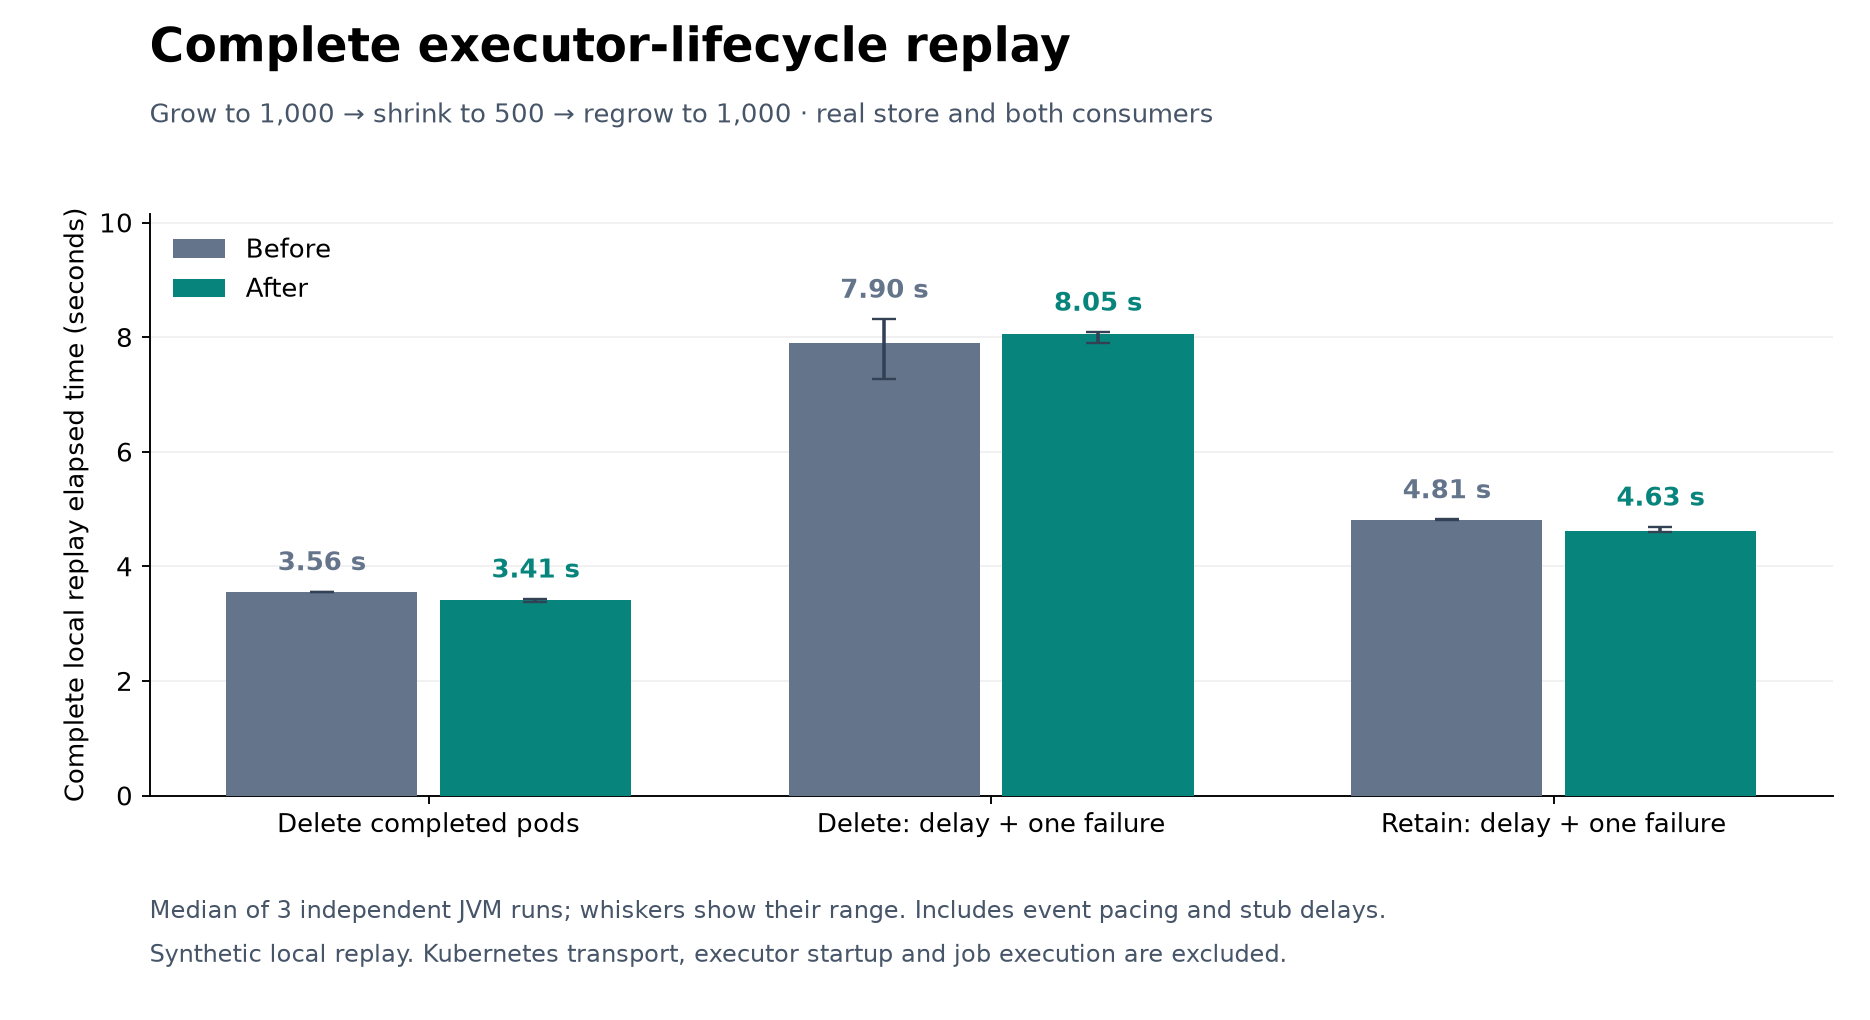 Index maintenance adds about 6-12 ms of producer work over each complete threaded trace. A separate fixed-schedule diagnostic estimates roughly 12 KB (+0.18%) more reachable snapshot backlog memory; this is a sampled estimate, not a peak-heap bound or leak test. Retained-pod runs showed higher batch-entry waits when blocking patch calls split events into different batches. Follow-up tracing measured actual event-to-backend-removal p95 improving in two pairs (1429 -> 1309 ms and 1388 -> 1332 ms). This does not establish universally better latency; the original batch-entry metric excluded processing within a batch. [Harness sources, raw samples, reproduction instructions and latency investigation](https://github.com/ForVic/spark/tree/bc214b28dc1e677be8843b0bbc7ade4fda7a6ac7) are kept separately from the proposed Spark diff. These benchmarks ran locally, not in GitHub Actions. No real Kubernetes cluster or executor processes were used; API throttling/transport, PVC reuse, multiple resource profiles and long-running behavior remain outside this validation. ### Was this patch authored or co-authored using generative AI tooling? Generated-by: OpenAI Codex (GPT-6) -- This is an automated message from the Apache Git Service. To respond to the message, please log on to GitHub and use the URL above to go to the specific comment. To unsubscribe, e-mail: [email protected] For queries about this service, please contact Infrastructure at: [email protected] --------------------------------------------------------------------- To unsubscribe, e-mail: [email protected] For additional commands, e-mail: [email protected]


