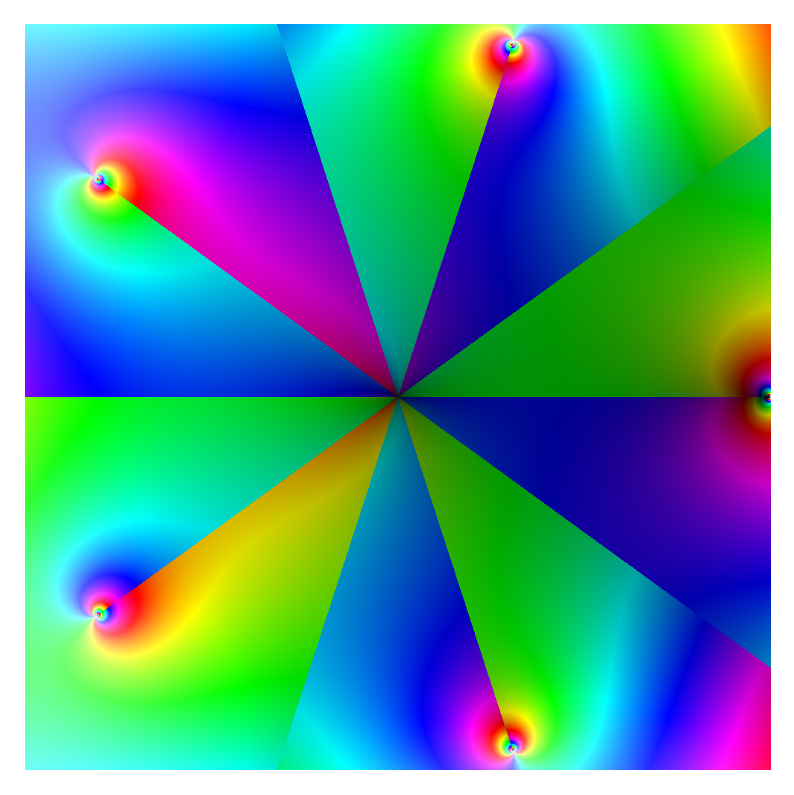
There are all sorts of nice possibilities with complex_plot.  As just
one example:
complex_plot(z*log(z)*exp((z^5+1)/(z^5-1)^(1/2)),(-1,1),(-1,1), axes =
False, figsize = [10,10], plot_points = 1000)

gives:

http://www.d.umn.edu/~mhampton/zlogzz5.png

Really the tip of the iceberg for that sort of stuff.

-Marshall

On Feb 23, 12:26 pm, William Stein <[email protected]> wrote:
> Hi,
>
> Send me your contribution for the Sagecalendarfor 2011.
>
> If you're somebody like Tom Boothby or Marshall Hampton that makes
> amazing hi-res sage images, this means you!
>
> William
>
> --
> William Stein
> Associate Professor of Mathematics
> University of Washingtonhttp://wstein.org

--
To post to this group, send an email to [email protected]
To unsubscribe from this group, send an email to
[email protected]
For more options, visit this group at http://groups.google.com/group/sage-devel
URL: http://www.sagemath.org