mhampton wrote:
There are all sorts of nice possibilities with complex_plot.  As just
one example:
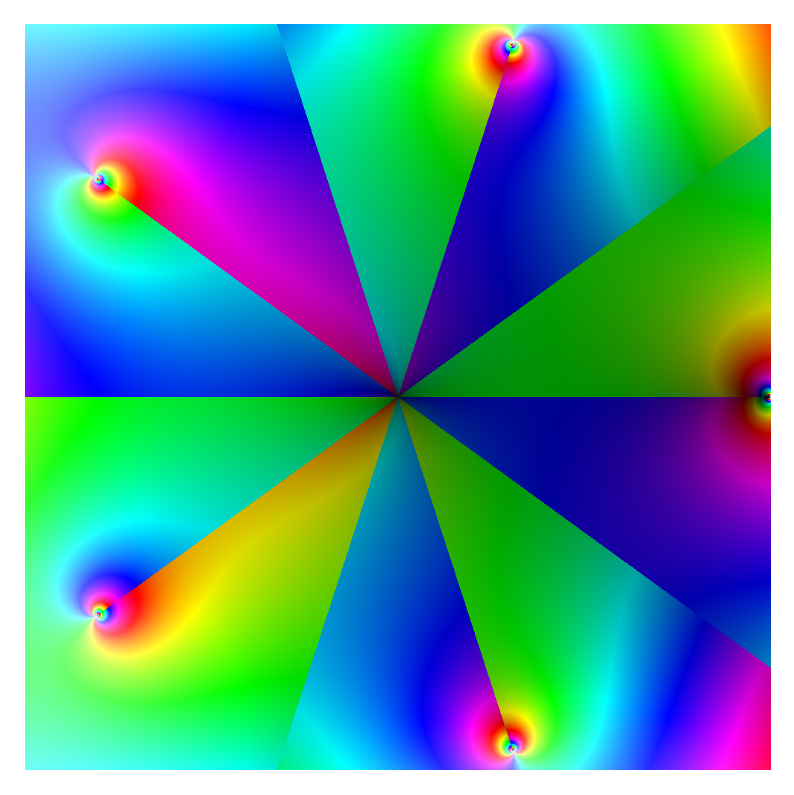
complex_plot(z*log(z)*exp((z^5+1)/(z^5-1)^(1/2)),(-1,1),(-1,1), axes =
False, figsize = [10,10], plot_points = 1000)

gives:

http://www.d.umn.edu/~mhampton/zlogzz5.png

Really the tip of the iceberg for that sort of stuff.

-Marshall
They are the sort of things that would be nice to have as pre-installed
'published' documents - see the thread of mine
http://groups.google.com/group/sage-devel/browse_thread/thread/6580ca4cc7b3e9d7/a3d0510292702460?hl=en&ie=UTF-8&q=Should+there+be+some+*good*+examples+on+notebook%3F#a3d0510292702460

There are some nice ones too at

http://gallery.wolfram.com/

They guy that wrote this book

http://www.amazon.com/Mathematica-Guidebook-Graphics-Michael-Trott/dp/0387950109
seems an expert at making nice images. I don't know sort of brain you need to
make such things. I understand how the Mandlebrot set is produced (spent ages
coding that in assembler once), but some of the stuff people produce is
breathtaking.
PS I'm captain of a chess team called "Chaotic Equations"

Dave

--
To post to this group, send an email to [email protected]
To unsubscribe from this group, send an email to
[email protected]
For more options, visit this group at http://groups.google.com/group/sage-devel
URL: http://www.sagemath.org