[GitHub] vasu-vvp commented on issue #9176: emphasis does not works for the custom series type
vasu-vvp commented on issue #9176: emphasis does not works for the custom
series type
URL:
https://github.com/apache/incubator-echarts/issues/9176#issuecomment-428829437


   Solved!
   Need to return "styleEmphasis" with the shape and style in renderItem
function.


This is an automated message from the Apache Git Service.
To respond to the message, please log on GitHub and use the
URL above to go to the specific comment.

For queries about this service, please contact Infrastructure at:
us...@infra.apache.org


With regards,
Apache Git Services

-
To unsubscribe, e-mail: dev-unsubscr...@echarts.apache.org
For additional commands, e-mail: dev-h...@echarts.apache.org
[GitHub] Ovilia commented on a change in pull request #9171: fix #8009 & #5969, symbol symbolSize and opacity setting for category itemStyle in graph
Ovilia commented on a change in pull request #9171: fix #8009 & #5969, symbol
symbolSize and opacity setting for category itemStyle in graph
URL: https://github.com/apache/incubator-echarts/pull/9171#discussion_r224321184


 ##
 File path: src/chart/graph/categoryVisual.js
 ##
 @@ -88,6 +100,27 @@ export default function (ecModel) {
 );
 }

+if (!data.getItemVisual(idx, 'symbolKeepAspect', true)) {

 Review comment:
   `['symbol', 'symbolSize', ''symbolKeepAspect', ...]`, all similar logic.


This is an automated message from the Apache Git Service.
To respond to the message, please log on GitHub and use the
URL above to go to the specific comment.

For queries about this service, please contact Infrastructure at:
us...@infra.apache.org


With regards,
Apache Git Services

-
To unsubscribe, e-mail: dev-unsubscr...@echarts.apache.org
For additional commands, e-mail: dev-h...@echarts.apache.org
[GitHub] Vvvickie commented on a change in pull request #9171: fix #8009 & #5969, symbol symbolSize and opacity setting for category itemStyle in graph
Vvvickie commented on a change in pull request #9171: fix #8009 & #5969, symbol
symbolSize and opacity setting for category itemStyle in graph
URL: https://github.com/apache/incubator-echarts/pull/9171#discussion_r224320613


 ##
 File path: src/chart/graph/categoryVisual.js
 ##
 @@ -88,6 +100,27 @@ export default function (ecModel) {
 );
 }

+if (!data.getItemVisual(idx, 'symbolKeepAspect', true)) {

 Review comment:
   Ummm, loop for what…?


This is an automated message from the Apache Git Service.
To respond to the message, please log on GitHub and use the
URL above to go to the specific comment.

For queries about this service, please contact Infrastructure at:
us...@infra.apache.org


With regards,
Apache Git Services

-
To unsubscribe, e-mail: dev-unsubscr...@echarts.apache.org
For additional commands, e-mail: dev-h...@echarts.apache.org
[GitHub] Ovilia closed pull request #9195: axisLine.show option implemented for Gauge
Ovilia closed pull request #9195: axisLine.show option implemented for Gauge
URL: https://github.com/apache/incubator-echarts/pull/9195


This is a PR merged from a forked repository.
As GitHub hides the original diff on merge, it is displayed below for
the sake of provenance:

As this is a foreign pull request (from a fork), the diff is supplied
below (as it won't show otherwise due to GitHub magic):

diff --git a/src/chart/gauge/GaugeView.js b/src/chart/gauge/GaugeView.js
index 3ec04399f..567f72ec4 100644
--- a/src/chart/gauge/GaugeView.js
+++ b/src/chart/gauge/GaugeView.js
@@ -85,8 +85,9 @@ var GaugeView = ChartView.extend({

 var prevEndAngle = startAngle;
 var axisLineWidth = lineStyleModel.get('width');
-
-for (var i = 0; i < colorList.length; i++) {
+var showAxis = axisLineModel.get('show');
+
+for (var i = 0; showAxis && i < colorList.length; i++) {
 // Clamp
 var percent = Math.min(Math.max(colorList[i][0], 0), 1);
 var endAngle = startAngle + angleRangeSpan * percent;
@@ -424,4 +425,4 @@ var GaugeView = ChartView.extend({
 }
 });

-export default GaugeView;
\ No newline at end of file
+export default GaugeView;


This is an automated message from the Apache Git Service.
To respond to the message, please log on GitHub and use the
URL above to go to the specific comment.

For queries about this service, please contact Infrastructure at:
us...@infra.apache.org


With regards,
Apache Git Services

-
To unsubscribe, e-mail: dev-unsubscr...@echarts.apache.org
For additional commands, e-mail: dev-h...@echarts.apache.org
[GitHub] Ovilia commented on a change in pull request #9171: fix #8009 & #5969, symbol symbolSize and opacity setting for category itemStyle in graph
Ovilia commented on a change in pull request #9171: fix #8009 & #5969, symbol
symbolSize and opacity setting for category itemStyle in graph
URL: https://github.com/apache/incubator-echarts/pull/9171#discussion_r224319256


 ##
 File path: src/chart/graph/categoryVisual.js
 ##
 @@ -88,6 +100,27 @@ export default function (ecModel) {
 );
 }

+if (!data.getItemVisual(idx, 'symbolKeepAspect', true)) {

 Review comment:
   Maybe a for-loop here?


This is an automated message from the Apache Git Service.
To respond to the message, please log on GitHub and use the
URL above to go to the specific comment.

For queries about this service, please contact Infrastructure at:
us...@infra.apache.org


With regards,
Apache Git Services

-
To unsubscribe, e-mail: dev-unsubscr...@echarts.apache.org
For additional commands, e-mail: dev-h...@echarts.apache.org
[GitHub] YuriGor commented on issue #9195: axisLine.show option implemented for Gauge
YuriGor commented on issue #9195: axisLine.show option implemented for Gauge
URL:
https://github.com/apache/incubator-echarts/pull/9195#issuecomment-428815513


   Fixed


This is an automated message from the Apache Git Service.
To respond to the message, please log on GitHub and use the
URL above to go to the specific comment.

For queries about this service, please contact Infrastructure at:
us...@infra.apache.org


With regards,
Apache Git Services

-
To unsubscribe, e-mail: dev-unsubscr...@echarts.apache.org
For additional commands, e-mail: dev-h...@echarts.apache.org
[GitHub] fuxinruming commented on issue #9199: 散点图在新版本中悬浮偏移问题
fuxinruming commented on issue #9199: 散点图在新版本中悬浮偏移问题
URL:
https://github.com/apache/incubator-echarts/issues/9199#issuecomment-428807494


   非常感谢


This is an automated message from the Apache Git Service.
To respond to the message, please log on GitHub and use the
URL above to go to the specific comment.

For queries about this service, please contact Infrastructure at:
us...@infra.apache.org


With regards,
Apache Git Services

-
To unsubscribe, e-mail: dev-unsubscr...@echarts.apache.org
For additional commands, e-mail: dev-h...@echarts.apache.org
[GitHub] fuxinruming closed issue #9199: 散点图在新版本中悬浮偏移问题
fuxinruming closed issue #9199: 散点图在新版本中悬浮偏移问题
URL: https://github.com/apache/incubator-echarts/issues/9199


This is an automated message from the Apache Git Service.
To respond to the message, please log on GitHub and use the
URL above to go to the specific comment.

For queries about this service, please contact Infrastructure at:
us...@infra.apache.org


With regards,
Apache Git Services

-
To unsubscribe, e-mail: dev-unsubscr...@echarts.apache.org
For additional commands, e-mail: dev-h...@echarts.apache.org
[GitHub] Ovilia commented on issue #9199: 散点图在新版本中悬浮偏移问题
Ovilia commented on issue #9199: 散点图在新版本中悬浮偏移问题
URL:
https://github.com/apache/incubator-echarts/issues/9199#issuecomment-428806363


   给 `option` 设一个 `animation: false,`


This is an automated message from the Apache Git Service.
To respond to the message, please log on GitHub and use the
URL above to go to the specific comment.

For queries about this service, please contact Infrastructure at:
us...@infra.apache.org


With regards,
Apache Git Services

-
To unsubscribe, e-mail: dev-unsubscr...@echarts.apache.org
For additional commands, e-mail: dev-h...@echarts.apache.org
[GitHub] Ovilia closed issue #9126: Avoid zoom restore when data is changed
Ovilia closed issue #9126: Avoid zoom restore when data is changed
URL: https://github.com/apache/incubator-echarts/issues/9126


This is an automated message from the Apache Git Service.
To respond to the message, please log on GitHub and use the
URL above to go to the specific comment.

For queries about this service, please contact Infrastructure at:
us...@infra.apache.org


With regards,
Apache Git Services

-
To unsubscribe, e-mail: dev-unsubscr...@echarts.apache.org
For additional commands, e-mail: dev-h...@echarts.apache.org
[GitHub] Ovilia closed issue #9129: IE下canvas的问题
Ovilia closed issue #9129: IE下canvas的问题
URL: https://github.com/apache/incubator-echarts/issues/9129


This is an automated message from the Apache Git Service.
To respond to the message, please log on GitHub and use the
URL above to go to the specific comment.

For queries about this service, please contact Infrastructure at:
us...@infra.apache.org


With regards,
Apache Git Services

-
To unsubscribe, e-mail: dev-unsubscr...@echarts.apache.org
For additional commands, e-mail: dev-h...@echarts.apache.org
[GitHub] Ovilia commented on issue #9124: touch events support + touch device legend touch scroll + manual coding
Ovilia commented on issue #9124: touch events support + touch device legend
touch scroll + manual coding
URL:
https://github.com/apache/incubator-echarts/issues/9124#issuecomment-428805769


   I'm afraid ECharts cannot provide touch events for all components. Or at
lease we are not intended to do so.
   Sorry for the late reply. As you can see, ECharts has so many issues and we
work in our spare time to do all these things.
   I'm closing this issue for we cannot provide a better solution right now.


This is an automated message from the Apache Git Service.
To respond to the message, please log on GitHub and use the
URL above to go to the specific comment.

For queries about this service, please contact Infrastructure at:
us...@infra.apache.org


With regards,
Apache Git Services

-
To unsubscribe, e-mail: dev-unsubscr...@echarts.apache.org
For additional commands, e-mail: dev-h...@echarts.apache.org
[GitHub] Ovilia closed issue #9124: touch events support + touch device legend touch scroll + manual coding
Ovilia closed issue #9124: touch events support + touch device legend touch
scroll + manual coding
URL: https://github.com/apache/incubator-echarts/issues/9124


This is an automated message from the Apache Git Service.
To respond to the message, please log on GitHub and use the
URL above to go to the specific comment.

For queries about this service, please contact Infrastructure at:
us...@infra.apache.org


With regards,
Apache Git Services

-
To unsubscribe, e-mail: dev-unsubscr...@echarts.apache.org
For additional commands, e-mail: dev-h...@echarts.apache.org
[GitHub] fuxinruming opened a new issue #9199: 散点图在新版本中悬浮偏移问题
fuxinruming opened a new issue #9199: 散点图在新版本中悬浮偏移问题
URL: https://github.com/apache/incubator-echarts/issues/9199


   ### One-line summary [问题简述]
   http://echarts.baidu.com/examples/editor.html?c=map-polygon
散点图在新版本中悬浮偏移,当拖动地图移动时,散点也会随着动,然后回到原处


   ### Version & Environment [版本及环境]
   + ECharts version [ECharts 版本]:4.0.4
   + Browser version [浏览器类型和版本]:65.0.3325.181谷歌  32位
   + OS Version [操作系统类型和版本]:win10


   ### Expected behaviour [期望结果]
   地图上的散点不随着地图拖动而动,以前的3.8.5版本无此问题


   ### ECharts option [ECharts配置项]


   ```javascript
   option = {

   }

   ```


   ### Other comments [其他信息]


This is an automated message from the Apache Git Service.
To respond to the message, please log on GitHub and use the
URL above to go to the specific comment.

For queries about this service, please contact Infrastructure at:
us...@infra.apache.org


With regards,
Apache Git Services

-
To unsubscribe, e-mail: dev-unsubscr...@echarts.apache.org
For additional commands, e-mail: dev-h...@echarts.apache.org
[GitHub] Ovilia closed issue #9079: 柱状图series中的data个数不一致时溢出
Ovilia closed issue #9079: 柱状图series中的data个数不一致时溢出
URL: https://github.com/apache/incubator-echarts/issues/9079


This is an automated message from the Apache Git Service.
To respond to the message, please log on GitHub and use the
URL above to go to the specific comment.

For queries about this service, please contact Infrastructure at:
us...@infra.apache.org


With regards,
Apache Git Services

-
To unsubscribe, e-mail: dev-unsubscr...@echarts.apache.org
For additional commands, e-mail: dev-h...@echarts.apache.org
[GitHub] Ovilia closed issue #9061: toolbox中的icon
Ovilia closed issue #9061: toolbox中的icon
URL: https://github.com/apache/incubator-echarts/issues/9061


This is an automated message from the Apache Git Service.
To respond to the message, please log on GitHub and use the
URL above to go to the specific comment.

For queries about this service, please contact Infrastructure at:
us...@infra.apache.org


With regards,
Apache Git Services

-
To unsubscribe, e-mail: dev-unsubscr...@echarts.apache.org
For additional commands, e-mail: dev-h...@echarts.apache.org
[GitHub] Ovilia closed issue #9108: echarts4 visualmap dimension设为0之外的数字color映射失效
Ovilia closed issue #9108: echarts4 visualmap dimension设为0之外的数字color映射失效
URL: https://github.com/apache/incubator-echarts/issues/9108


This is an automated message from the Apache Git Service.
To respond to the message, please log on GitHub and use the
URL above to go to the specific comment.

For queries about this service, please contact Infrastructure at:
us...@infra.apache.org


With regards,
Apache Git Services

-
To unsubscribe, e-mail: dev-unsubscr...@echarts.apache.org
For additional commands, e-mail: dev-h...@echarts.apache.org
[GitHub] Ovilia commented on issue #9198: Line Chart sometimes doesn't render properly.
Ovilia commented on issue #9198: Line Chart sometimes doesn't render properly.
URL:
https://github.com/apache/incubator-echarts/issues/9198#issuecomment-428804706


   Please provide a runnable full example at jsfiddle.net.


This is an automated message from the Apache Git Service.
To respond to the message, please log on GitHub and use the
URL above to go to the specific comment.

For queries about this service, please contact Infrastructure at:
us...@infra.apache.org


With regards,
Apache Git Services

-
To unsubscribe, e-mail: dev-unsubscr...@echarts.apache.org
For additional commands, e-mail: dev-h...@echarts.apache.org
[GitHub] Ovilia commented on issue #9196: Echarts theme
Ovilia commented on issue #9196: Echarts theme
URL:
https://github.com/apache/incubator-echarts/issues/9196#issuecomment-428804154


   If a them is downloaded as a JS file, it will auto register itself:

   ```js
   // Import the `vintage.js` file in HTML, then:
   var chart = echarts.init(dom, 'vintage');
   // ...
   ```

   Please see:
http://echarts.apache.org/tutorial.html#Overview%20of%20Style%20Customization


This is an automated message from the Apache Git Service.
To respond to the message, please log on GitHub and use the
URL above to go to the specific comment.

For queries about this service, please contact Infrastructure at:
us...@infra.apache.org


With regards,
Apache Git Services

-
To unsubscribe, e-mail: dev-unsubscr...@echarts.apache.org
For additional commands, e-mail: dev-h...@echarts.apache.org
Re: ICLA of new committer
Hi Kevin,

Thanks for your reply.

What happens if secretary doesn't reply?

Zhang Wenli
http://zhangwenli.com


On Mon, Oct 8, 2018 at 7:55 PM Kevin A. McGrail
wrote:

> Hi Zhang,
>
> With the ICLA, you are free to use the PR as the project deems best.  I
> have forwarded your email to secretary@ so they can record the document.
>
> Congrats on building your community!
>
> Regards,
> KAM
> On 10/8/2018 2:38 AM, Wenli Zhang wrote:
>
> PDF in last email is too large. Here's a compressed version.
>
> Zhang Wenli
> http://zhangwenli.com
>
>
> On Mon, Oct 8, 2018 at 2:35 PM Wenli Zhang  wrote:
>
>> Dear mentors,
>>
>> We have merged a pull request (
>> https://github.com/apache/incubator-echarts/pull/8759) from the
>> community, and his ICLA file is attached in this email.
>>
>> This is the first time we merge a PR after we joined Apache. So please
>> tell us if there's anything else we need to do.
>>
>> Thanks!
>>
>> Zhang Wenli
>> http://zhangwenli.com
>>
>
> --
> *Kevin A. McGrail*
> 703-798-0171 (wireless)
> https://www.linkedin.com/in/kmcgrail
>
[GitHub] Ovilia commented on issue #9195: axisLine.show option implemented for Gauge
Ovilia commented on issue #9195: axisLine.show option implemented for Gauge
URL:
https://github.com/apache/incubator-echarts/pull/9195#issuecomment-428803201


   @YuriGor Thanks for your contribution.
   Please fix the problems mentioned above before we can merge it.


This is an automated message from the Apache Git Service.
To respond to the message, please log on GitHub and use the
URL above to go to the specific comment.

For queries about this service, please contact Infrastructure at:
us...@infra.apache.org


With regards,
Apache Git Services

-
To unsubscribe, e-mail: dev-unsubscr...@echarts.apache.org
For additional commands, e-mail: dev-h...@echarts.apache.org
[GitHub] Ovilia commented on a change in pull request #9195: axisLine.show option implemented for Gauge
Ovilia commented on a change in pull request #9195: axisLine.show option
implemented for Gauge
URL: https://github.com/apache/incubator-echarts/pull/9195#discussion_r224301211


 ##
 File path: src/chart/gauge/GaugeView.js
 ##
 @@ -85,8 +85,9 @@ var GaugeView = ChartView.extend({

 var prevEndAngle = startAngle;
 var axisLineWidth = lineStyleModel.get('width');
-
-for (var i = 0; i < colorList.length; i++) {
+var showAxis = axisLineModel.get("show");
+
+for (var i = 0;showAxis && i < colorList.length; i++) {

 Review comment:
   There should be a space before `showAxis`.


This is an automated message from the Apache Git Service.
To respond to the message, please log on GitHub and use the
URL above to go to the specific comment.

For queries about this service, please contact Infrastructure at:
us...@infra.apache.org


With regards,
Apache Git Services

-
To unsubscribe, e-mail: dev-unsubscr...@echarts.apache.org
For additional commands, e-mail: dev-h...@echarts.apache.org
[GitHub] Ovilia commented on a change in pull request #9195: axisLine.show option implemented for Gauge
Ovilia commented on a change in pull request #9195: axisLine.show option
implemented for Gauge
URL: https://github.com/apache/incubator-echarts/pull/9195#discussion_r224301165


 ##
 File path: src/chart/gauge/GaugeView.js
 ##
 @@ -85,8 +85,9 @@ var GaugeView = ChartView.extend({

 var prevEndAngle = startAngle;
 var axisLineWidth = lineStyleModel.get('width');
-
-for (var i = 0; i < colorList.length; i++) {
+var showAxis = axisLineModel.get("show");

 Review comment:
   Please use `'` instead of `"`.


This is an automated message from the Apache Git Service.
To respond to the message, please log on GitHub and use the
URL above to go to the specific comment.

For queries about this service, please contact Infrastructure at:
us...@infra.apache.org


With regards,
Apache Git Services

-
To unsubscribe, e-mail: dev-unsubscr...@echarts.apache.org
For additional commands, e-mail: dev-h...@echarts.apache.org
[GitHub] Ovilia commented on issue #9193: 横坐标怎么设定起始和末尾时间,数据就在这段区间加载,但是数据是动态的,不知道数据中时间集合
Ovilia commented on issue #9193: 横坐标怎么设定起始和末尾时间,数据就在这段区间加载,但是数据是动态的,不知道数据中时间集合
URL:
https://github.com/apache/incubator-echarts/issues/9193#issuecomment-428801508


   坐标轴用 `'time'` 类型,然后设 `'min'`、`'max'` 可以不?


This is an automated message from the Apache Git Service.
To respond to the message, please log on GitHub and use the
URL above to go to the specific comment.

For queries about this service, please contact Infrastructure at:
us...@infra.apache.org


With regards,
Apache Git Services

-
To unsubscribe, e-mail: dev-unsubscr...@echarts.apache.org
For additional commands, e-mail: dev-h...@echarts.apache.org
[GitHub] Ovilia closed issue #9191: 折线图的brush
Ovilia closed issue #9191: 折线图的brush
URL: https://github.com/apache/incubator-echarts/issues/9191


This is an automated message from the Apache Git Service.
To respond to the message, please log on GitHub and use the
URL above to go to the specific comment.

For queries about this service, please contact Infrastructure at:
us...@infra.apache.org


With regards,
Apache Git Services

-
To unsubscribe, e-mail: dev-unsubscr...@echarts.apache.org
For additional commands, e-mail: dev-h...@echarts.apache.org
[GitHub] Ovilia commented on issue #9190: Echarts 4.x 在线定制,graph图表渲染时会有透明度
Ovilia commented on issue #9190: Echarts 4.x 在线定制,graph图表渲染时会有透明度
URL:
https://github.com/apache/incubator-echarts/issues/9190#issuecomment-428800727


   代码?


This is an automated message from the Apache Git Service.
To respond to the message, please log on GitHub and use the
URL above to go to the specific comment.

For queries about this service, please contact Infrastructure at:
us...@infra.apache.org


With regards,
Apache Git Services

-
To unsubscribe, e-mail: dev-unsubscr...@echarts.apache.org
For additional commands, e-mail: dev-h...@echarts.apache.org
[GitHub] Ovilia commented on issue #9188: tooltip formatter when using axis trigger
Ovilia commented on issue #9188: tooltip formatter when using axis trigger
URL:
https://github.com/apache/incubator-echarts/issues/9188#issuecomment-428800349


   If you have 3 series of 100 data each, `params` will be an array of length
3, rather than 100.
   And since `trigger` is axis, we can't know which one of the three is the
active one. In fact, we should say, all three of them is active. So it's
expected behavior.


This is an automated message from the Apache Git Service.
To respond to the message, please log on GitHub and use the
URL above to go to the specific comment.

For queries about this service, please contact Infrastructure at:
us...@infra.apache.org


With regards,
Apache Git Services

-
To unsubscribe, e-mail: dev-unsubscr...@echarts.apache.org
For additional commands, e-mail: dev-h...@echarts.apache.org
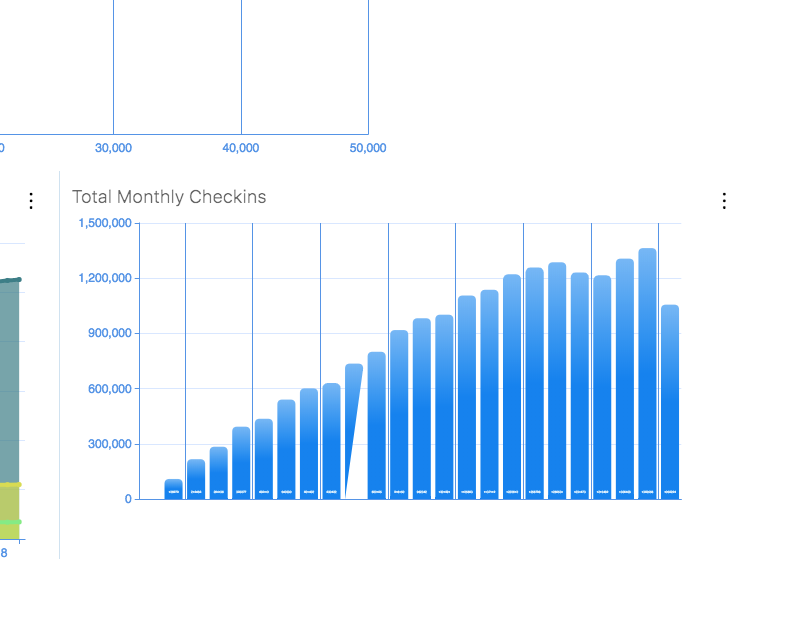
[GitHub] syntacticsolutions opened a new issue #9198: Line Chart sometimes doesn't render properly.
syntacticsolutions opened a new issue #9198: Line Chart sometimes doesn't
render properly.
URL: https://github.com/apache/incubator-echarts/issues/9198
### One-line summary [问题简述]
Line Chart sometimes doesn't render properly
### Version & Environment [版本及环境]
+ ECharts version [ECharts 版本]: 4.1.0
+ Browser version [浏览器类型和版本]: Latest Chrome
+ OS Version [操作系统类型和版本]: Latest High Sierra
### Expected behaviour [期望结果]
All of the bars should be full and extend from the bottom to the top of it's
value.
### ECharts option [ECharts配置项]
```javascript
let option = {
tooltip: this.tooltip,
// title: _.extend({ text: this.contents.title },
this.title),
legend: this.contents.origLegend ? {
data: this.contents.yVals,
itemWidth: 20,
width: this.contents.report ? 1000 : '100%',
bottom: this.contents.report ? 24 :
this.contents.origLegend ? null : -7,
top: this.contents.origLegend ? -4 : null,
left: 25,
align: 'left',
type: 'scroll',
show: this.colors.length
} : null,
// _.extend({ data: this.contents.yVals }, this.legend),
grid: {
left: !this.colors.length ? '140' : this.contents.report
? '100' : '40',
right: 30,
bottom: this.contents.report ? 60 : 20,
top: this.contents.report ? 60 :
this.contents.origLegend ? 30 : 5
},
dataView: {
lang: ['en-US']
},
// dataZoom: [
// {
// show: !this.contents.report
// }
// ],
xAxis: {
type: 'category',
// name: this.contents.xVal,
// nameLocation: 'middle',
nameTextStyle: {
},
nameGap: this.contents.report ? 35 : 15,
data: this.xList,
stack: 'something',
boundaryGap: true,
splitLine: {
show: false,
interval: 'auto',
lineStyle: {
color: ['#D4DFF5']
}
},
axisTick: {
show: true
},
axisLine: {
show: true,
lineStyle: {
color: '#609ee9'
}
},
axisLabel: {
show: true,
// margin: 10,
textStyle: {
fontSize: 12
},
formatter: val => val.dtToDate()
}
},
yAxis: {
type: 'value',
name: this.contents.yVal,
offset: -5,
splitLine: {
show: true,
lineStyle: {
color: ['rgba(0,100,255, 0.15)']
}
},
axisTick: {
show: true
},
axisLine: {
lineStyle: {
color: '#609ee9'
},
show: true,
margin: -40,
interval: 100
},
axisLabel: {
show: true,
textStyle: {
fontSize: 10
}
}
},
series: this.yTrends.map(((arr, i) => ({
name: this.contents.yVals[i],
type: 'line',
smooth: true,
showSymbol: true,
areaStyle: this.areaStyle,
symbol: 'circle',
symbolSize: 5,
data: arr,
[GitHub] Ovilia commented on issue #9187: Performance is poor if series has a lot of data
Ovilia commented on issue #9187: Performance is poor if series has a lot of data
URL:
https://github.com/apache/incubator-echarts/issues/9187#issuecomment-428799111


   You have 2000 series? Basically, 2000 data each for small amount of series
have a better performance.


This is an automated message from the Apache Git Service.
To respond to the message, please log on GitHub and use the
URL above to go to the specific comment.

For queries about this service, please contact Infrastructure at:
us...@infra.apache.org


With regards,
Apache Git Services

-
To unsubscribe, e-mail: dev-unsubscr...@echarts.apache.org
For additional commands, e-mail: dev-h...@echarts.apache.org
[GitHub] Ovilia commented on issue #9186: Event listener on group of bars in bar-graph
Ovilia commented on issue #9186: Event listener on group of bars in bar-graph
URL:
https://github.com/apache/incubator-echarts/issues/9186#issuecomment-428798750


   Seems not to be feasible right now.


This is an automated message from the Apache Git Service.
To respond to the message, please log on GitHub and use the
URL above to go to the specific comment.

For queries about this service, please contact Infrastructure at:
us...@infra.apache.org


With regards,
Apache Git Services

-
To unsubscribe, e-mail: dev-unsubscr...@echarts.apache.org
For additional commands, e-mail: dev-h...@echarts.apache.org
[GitHub] Ovilia closed issue #7969: 在graph关系图中,categories->itemStyle->borderWidth等不生效,但是color是生效的。
Ovilia closed issue #7969:
在graph关系图中,categories->itemStyle->borderWidth等不生效,但是color是生效的。
URL: https://github.com/apache/incubator-echarts/issues/7969


This is an automated message from the Apache Git Service.
To respond to the message, please log on GitHub and use the
URL above to go to the specific comment.

For queries about this service, please contact Infrastructure at:
us...@infra.apache.org


With regards,
Apache Git Services

-
To unsubscribe, e-mail: dev-unsubscr...@echarts.apache.org
For additional commands, e-mail: dev-h...@echarts.apache.org
[GitHub] liyuanqiu commented on issue #9197: series.lines shows nothing when xAxis is time
liyuanqiu commented on issue #9197: series.lines shows nothing when xAxis is
time
URL:
https://github.com/apache/incubator-echarts/issues/9197#issuecomment-428797623


   Oh...I found that if I specify xAxis.min and xAxis.max, everything will work.

   So in principle, this issue is resolved.

   But I think it should automatically set axis.min and axis.max according to
my given values.

   Maybe this can be an enhancement.


This is an automated message from the Apache Git Service.
To respond to the message, please log on GitHub and use the
URL above to go to the specific comment.

For queries about this service, please contact Infrastructure at:
us...@infra.apache.org


With regards,
Apache Git Services

-
To unsubscribe, e-mail: dev-unsubscr...@echarts.apache.org
For additional commands, e-mail: dev-h...@echarts.apache.org
[GitHub] liyuanqiu opened a new issue #9197: series.lines shows nothing when xAxis is time
liyuanqiu opened a new issue #9197: series.lines shows nothing when xAxis is
time
URL: https://github.com/apache/incubator-echarts/issues/9197


   ### One-line summary [问题简述]
   当series的type为lines,且xAxis的type为time,不能正确绘制图表,详见下面我给出的option以及JSFiddle


   ### Version & Environment [版本及环境]
   + ECharts version [ECharts 版本]: latest
   + Browser version [浏览器类型和版本]: 69
   + OS Version [操作系统类型和版本]: macOS


   ### Expected behaviour [期望结果]
   能够正常显示出线条


   ### ECharts option [ECharts配置项]


   ```javascript
   option = {
   xAxis: {
   type: 'time',
   },
   yAxis: {
   type: 'category',
   data: ['A', 'B'],
   },
   series: [{
   data: [{
   coords: [
   [146229440, 'A'],
   [146229450, 'A'],
   ],
   }, {
   coords: [
   [146229445, 'B'],
   [146229455, 'B'],
   ],
   }],
   type: 'lines',
   coordinateSystem: 'cartesian2d',
   silent: false,
   }]
   }
   ```


   ### Other comments [其他信息]


   http://jsfiddle.net/gwnr7z5h/


This is an automated message from the Apache Git Service.
To respond to the message, please log on GitHub and use the
URL above to go to the specific comment.

For queries about this service, please contact Infrastructure at:
us...@infra.apache.org


With regards,
Apache Git Services

-
To unsubscribe, e-mail: dev-unsubscr...@echarts.apache.org
For additional commands, e-mail: dev-h...@echarts.apache.org
[GitHub] laroussimoez opened a new issue #9196: Echarts theme
laroussimoez opened a new issue #9196: Echarts theme
URL: https://github.com/apache/incubator-echarts/issues/9196


   How to select a theme, when using only plain javascript?


This is an automated message from the Apache Git Service.
To respond to the message, please log on GitHub and use the
URL above to go to the specific comment.

For queries about this service, please contact Infrastructure at:
us...@infra.apache.org


With regards,
Apache Git Services

-
To unsubscribe, e-mail: dev-unsubscr...@echarts.apache.org
For additional commands, e-mail: dev-h...@echarts.apache.org
[GitHub] Vvvickie edited a comment on issue #7969: 在graph关系图中,categories->itemStyle->borderWidth等不生效,但是color是生效的。
Vvvickie edited a comment on issue #7969:
在graph关系图中,categories->itemStyle->borderWidth等不生效,但是color是生效的。
URL:
https://github.com/apache/incubator-echarts/issues/7969#issuecomment-428737181


   > is this a bug?

   The series[i]-graph.data[i].category should be the index of certain category
in categories.

   So the code should be:
   ```
   data: [
   {
 draggable: true,
 name: "AGOTOZ",
 symbolSize: 120
   },
   {
 name: "节点1",//  节点名称
 category: 0,
 symbolSize: 60// 标签大小
   },
   {
 name: "节点2",//  节点名称
 category: 1,
 symbolSize: 90// 标签大小
   }
   ],// 数据渲染

   ```

   Hope it helps.


This is an automated message from the Apache Git Service.
To respond to the message, please log on GitHub and use the
URL above to go to the specific comment.

For queries about this service, please contact Infrastructure at:
us...@infra.apache.org


With regards,
Apache Git Services

-
To unsubscribe, e-mail: dev-unsubscr...@echarts.apache.org
For additional commands, e-mail: dev-h...@echarts.apache.org
[GitHub] Vvvickie edited a comment on issue #7969: 在graph关系图中,categories->itemStyle->borderWidth等不生效,但是color是生效的。
Vvvickie edited a comment on issue #7969:
在graph关系图中,categories->itemStyle->borderWidth等不生效,但是color是生效的。
URL:
https://github.com/apache/incubator-echarts/issues/7969#issuecomment-428737181


   > is this a bug?

   The series[i]-graph.data[i].category should be the index of certain category
in categories.

   So the code should be:
   ```
   data: [
   {
 draggable: true,
 name: "AGOTOZ",
 symbolSize: 120
   },
   {
 name: "节点1",//  节点名称
 category: 0,
 symbolSize: 60// 标签大小
   },
   {
 name: "节点2",//  节点名称
 category: 1,
 symbolSize: 90// 标签大小
   }
 ],// 数据渲染

   ```

   Hope it helps.


This is an automated message from the Apache Git Service.
To respond to the message, please log on GitHub and use the
URL above to go to the specific comment.

For queries about this service, please contact Infrastructure at:
us...@infra.apache.org


With regards,
Apache Git Services

-
To unsubscribe, e-mail: dev-unsubscr...@echarts.apache.org
For additional commands, e-mail: dev-h...@echarts.apache.org
[GitHub] Vvvickie commented on issue #7969: 在graph关系图中,categories->itemStyle->borderWidth等不生效,但是color是生效的。
Vvvickie commented on issue #7969:
在graph关系图中,categories->itemStyle->borderWidth等不生效,但是color是生效的。
URL:
https://github.com/apache/incubator-echarts/issues/7969#issuecomment-428737181


   > is this a bug?

   The series[i]-graph.data[i].category should be the index of certain category
in categories.

   So the code should be:
   ```data: [
   {
 draggable: true,
 name: "AGOTOZ",
 symbolSize: 120
   },
   {
 name: "节点1",//  节点名称
 category: 0,
 symbolSize: 60// 标签大小
   },
   {
 name: "节点2",//  节点名称
 category: 1,
 symbolSize: 90// 标签大小
   }
 ],// 数据渲染

   ```

   Hope it helps.


This is an automated message from the Apache Git Service.
To respond to the message, please log on GitHub and use the
URL above to go to the specific comment.

For queries about this service, please contact Infrastructure at:
us...@infra.apache.org


With regards,
Apache Git Services

-
To unsubscribe, e-mail: dev-unsubscr...@echarts.apache.org
For additional commands, e-mail: dev-h...@echarts.apache.org
[GitHub] YuriGor opened a new pull request #9195: axisLine.show option implemented for Gauge
YuriGor opened a new pull request #9195: axisLine.show option implemented for
Gauge
URL: https://github.com/apache/incubator-echarts/pull/9195


   As described in  #9194 - echarts ignores axisLine.show option. Support for
this option added by this commit.


This is an automated message from the Apache Git Service.
To respond to the message, please log on GitHub and use the
URL above to go to the specific comment.

For queries about this service, please contact Infrastructure at:
us...@infra.apache.org


With regards,
Apache Git Services

-
To unsubscribe, e-mail: dev-unsubscr...@echarts.apache.org
For additional commands, e-mail: dev-h...@echarts.apache.org
[GitHub] YuriGor opened a new issue #9194: axisLine.show doesn't work in the gauge
YuriGor opened a new issue #9194: axisLine.show doesn't work in the gauge
URL: https://github.com/apache/incubator-echarts/issues/9194


   axisLine.show doesn't work in the gauge
   Example from
[docs](https://ecomfe.github.io/echarts-examples/public/editor.html?c=gauge):
   ```
   option = {
   tooltip : {
   formatter: "{a} {b} : {c}%"
   },
   toolbox: {
   feature: {
   restore: {},
   saveAsImage: {}
   }
   },
   series: [
   {
   name: '业务指标',
   type: 'gauge',
   detail: {formatter:'{value}%'},
   data: [{value: 50, name: '完成率'}],
   axisLine: {"show": false}
   }
   ]
   };

   setInterval(function () {
   option.series[0].data[0].value = (Math.random() * 100).toFixed(2) - 0;
   myChart.setOption(option, true);
   },2000);

   ```


This is an automated message from the Apache Git Service.
To respond to the message, please log on GitHub and use the
URL above to go to the specific comment.

For queries about this service, please contact Infrastructure at:
us...@infra.apache.org


With regards,
Apache Git Services

-
To unsubscribe, e-mail: dev-unsubscr...@echarts.apache.org
For additional commands, e-mail: dev-h...@echarts.apache.org
[GitHub] Vvvickie edited a comment on issue #9171: fix #8009 & #5969, symbol symbolSize and opacity setting for category itemStyle in graph
Vvvickie edited a comment on issue #9171: fix #8009 & #5969, symbol symbolSize
and opacity setting for category itemStyle in graph
URL:
https://github.com/apache/incubator-echarts/pull/9171#issuecomment-428487430


   Completed, please check it again : )


This is an automated message from the Apache Git Service.
To respond to the message, please log on GitHub and use the
URL above to go to the specific comment.

For queries about this service, please contact Infrastructure at:
us...@infra.apache.org


With regards,
Apache Git Services

-
To unsubscribe, e-mail: dev-unsubscr...@echarts.apache.org
For additional commands, e-mail: dev-h...@echarts.apache.org
[GitHub] Carolineliu opened a new issue #9193: 横坐标怎么设定起始和末尾时间,数据就在这段区间加载,但是数据是动态的,不知道数据中时间集合
Carolineliu opened a new issue #9193:
横坐标怎么设定起始和末尾时间,数据就在这段区间加载,但是数据是动态的,不知道数据中时间集合
URL: https://github.com/apache/incubator-echarts/issues/9193


   ### One-line summary [问题简述]


   ### Version & Environment [版本及环境]
   + ECharts version [ECharts 版本]:
   + Browser version [浏览器类型和版本]:
   + OS Version [操作系统类型和版本]:


   ### Expected behaviour [期望结果]


   ### ECharts option [ECharts配置项]


   ```javascript
   option = {

   }

   ```


   ### Other comments [其他信息]


This is an automated message from the Apache Git Service.
To respond to the message, please log on GitHub and use the
URL above to go to the specific comment.

For queries about this service, please contact Infrastructure at:
us...@infra.apache.org


With regards,
Apache Git Services

-
To unsubscribe, e-mail: dev-unsubscr...@echarts.apache.org
For additional commands, e-mail: dev-h...@echarts.apache.org
[GitHub] weihl opened a new issue #9192: 多个map不能同时叠加在同一个geo上
weihl opened a new issue #9192: 多个map不能同时叠加在同一个geo上
URL: https://github.com/apache/incubator-echarts/issues/9192


   ### One-line summary [问题简述]


我注册了两个map,想同时绘制出来,做到缩放同步,怎么都实现不了,如果设置geoIndex是相同的,就叠加不上两个,如果设置不同的geoIndex,就不能做到缩放同步


   ### Version & Environment [版本及环境]
   + ECharts version [ECharts 版本]:
   + Browser version [浏览器类型和版本]:
   + OS Version [操作系统类型和版本]:
   echarts版本 4.2.0-rc.1


   ### Expected behaviour [期望结果]
   将多个map绘制到同一个geo上


   ### ECharts option [ECharts配置项]


   ```javascript
$.get('../data/zhejiang.json', function (city) {
   $.get('../data/zhejiangArea.json', function (pro) {
   echarts.registerMap('city', city, {});
   echarts.registerMap('pro', pro, {});
   var options = {
   backgroundColor: 'rgb(18,40,54)',
   geo: {
   map: 'pro',
   roam: true,
   itemStyle: {
   areaColor: 'rgb(18,40,54)',
   borderColor: 'rgba(0,239,248,0.1)',
   shadowBlur: 40,
   shadowColor: 'rgb(0,239,248)',
   opacity: 1.0
   },
   emphasis: {
   itemStyle: {
   areaColor: 'rgb(18,40,54)',
   borderColor: 'rgba(0,239,248,0.1)',
   shadowBlur: 40,
   shadowColor: 'rgb(0,239,248)',
   opacity: 1.0
   }
   }
   },
   series: [{
   type: 'map',
   map: 'city',
   roam: true,
   geoIndex:0,
   itemStyle: {
   areaColor: 'rgb(18,40,54)',
   borderWidth: 2,
   borderColor: 'rgba(0,239,248,0.1)',
   shadowColor: 'rgb(0,239,248)',
   shadowBlur: 5,
   opacity: 1.0
   },
   emphasis: {
   itemStyle: {
   borderWidth: 2,
   areaColor: 'rgb(18,40,54)',
   borderColor: 'rgba(0,239,248,0.1)',
   opacity: 1.0
   }
   }
   },
   {
   type: 'effectScatter',
   coordinateSystem: 'geo',
   symbolSize: 10,
   geoIndex: 0,
   rippleEffect: {
   period: 4,
   scale: 7,
   brushType: 'stroke'
   },
   itemStyle: {
   color: 'rgba(0,239,248,1.0)',
   shadowColor: 'rgba(0,239,248,1.0)',
   shadowBlur: 10
   },
   data: [[
   120.06947194165942,
   29.18081930491257
   ]]
   }
   ]
   };
   myCharts.setOption(options);
   })
   })
   ```


   ### Other comments [其他信息]


This is an automated message from the Apache Git Service.
To respond to the message, please log on GitHub and use the
URL above to go to the specific comment.

For queries about this service, please contact Infrastructure at:
us...@infra.apache.org


With regards,
Apache Git Services

-
To unsubscribe, e-mail: dev-unsubscr...@echarts.apache.org
For additional commands, e-mail: dev-h...@echarts.apache.org
[GitHub] Ovilia commented on issue #9185: 鼠标上移到饼图图例上时,饼块除了高亮,如何弹出提示信息
Ovilia commented on issue #9185: 鼠标上移到饼图图例上时,饼块除了高亮,如何弹出提示信息
URL:
https://github.com/apache/incubator-echarts/issues/9185#issuecomment-428526425


   除非有很多人有类似的需求


This is an automated message from the Apache Git Service.
To respond to the message, please log on GitHub and use the
URL above to go to the specific comment.

For queries about this service, please contact Infrastructure at:
us...@infra.apache.org


With regards,
Apache Git Services

-
To unsubscribe, e-mail: dev-unsubscr...@echarts.apache.org
For additional commands, e-mail: dev-h...@echarts.apache.org
[GitHub] Ovilia commented on issue #9183: try to make echarts international
Ovilia commented on issue #9183: try to make echarts international
URL:
https://github.com/apache/incubator-echarts/issues/9183#issuecomment-428526140


   OK. I understand. We will discuss about this problem. Thank you.


This is an automated message from the Apache Git Service.
To respond to the message, please log on GitHub and use the
URL above to go to the specific comment.

For queries about this service, please contact Infrastructure at:
us...@infra.apache.org


With regards,
Apache Git Services

-
To unsubscribe, e-mail: dev-unsubscr...@echarts.apache.org
For additional commands, e-mail: dev-h...@echarts.apache.org
[GitHub] vasu-vvp commented on issue #9176: emphasis does not works for the custom series type
vasu-vvp commented on issue #9176: emphasis does not works for the custom
series type
URL:
https://github.com/apache/incubator-echarts/issues/9176#issuecomment-428526209


   Thank you!


This is an automated message from the Apache Git Service.
To respond to the message, please log on GitHub and use the
URL above to go to the specific comment.

For queries about this service, please contact Infrastructure at:
us...@infra.apache.org


With regards,
Apache Git Services

-
To unsubscribe, e-mail: dev-unsubscr...@echarts.apache.org
For additional commands, e-mail: dev-h...@echarts.apache.org
[GitHub] Ovilia commented on issue #9176: emphasis does not works for the custom series type
Ovilia commented on issue #9176: emphasis does not works for the custom series
type
URL:
https://github.com/apache/incubator-echarts/issues/9176#issuecomment-428525949


   @vasu-vvp Sorry for the register problem. Never mind...
   @100pah will have a lot at it.


This is an automated message from the Apache Git Service.
To respond to the message, please log on GitHub and use the
URL above to go to the specific comment.

For queries about this service, please contact Infrastructure at:
us...@infra.apache.org


With regards,
Apache Git Services

-
To unsubscribe, e-mail: dev-unsubscr...@echarts.apache.org
For additional commands, e-mail: dev-h...@echarts.apache.org
[GitHub] vasu-vvp edited a comment on issue #9176: emphasis does not works for the custom series type
vasu-vvp edited a comment on issue #9176: emphasis does not works for the
custom series type
URL:
https://github.com/apache/incubator-echarts/issues/9176#issuecomment-428525027


   What is missing here ? I am not able to register at
http://gallery.echartsjs.com/editor.html since it requires mobile number and
for my number its shows error  "Phone number format is incorrect"
   This demo is already available
[here](https://ecomfe.github.io/echarts-examples/public/editor.html?c=bar-histogram)
   You just need to put following code after line number 74.
   `emphasis:{
   itemStyle : {
   borderColor : 'red',
   color: 'blue'
   }
   },
   encode: {
   x: [0, 1],
   y: 2,
   tooltip: 2,
   label: 2
   },`


This is an automated message from the Apache Git Service.
To respond to the message, please log on GitHub and use the
URL above to go to the specific comment.

For queries about this service, please contact Infrastructure at:
us...@infra.apache.org


With regards,
Apache Git Services

-
To unsubscribe, e-mail: dev-unsubscr...@echarts.apache.org
For additional commands, e-mail: dev-h...@echarts.apache.org
[GitHub] vasu-vvp commented on issue #9176: emphasis does not works for the custom series type
vasu-vvp commented on issue #9176: emphasis does not works for the custom
series type
URL:
https://github.com/apache/incubator-echarts/issues/9176#issuecomment-428525027


   What is missing here ? I am not able to register at
http://gallery.echartsjs.com/editor.html since it requires mobile number and
for my number its shows error  "Phone number format is incorrect"
   This demo is already available
[here](https://ecomfe.github.io/echarts-examples/public/editor.html?c=bar-histogram)
   Just put after line number 74.
   `emphasis:{
   itemStyle : {
   borderColor : 'red',
   color: 'blue'
   }
   },
   encode: {
   x: [0, 1],
   y: 2,
   tooltip: 2,
   label: 2
   },`


This is an automated message from the Apache Git Service.
To respond to the message, please log on GitHub and use the
URL above to go to the specific comment.

For queries about this service, please contact Infrastructure at:
us...@infra.apache.org


With regards,
Apache Git Services

-
To unsubscribe, e-mail: dev-unsubscr...@echarts.apache.org
For additional commands, e-mail: dev-h...@echarts.apache.org
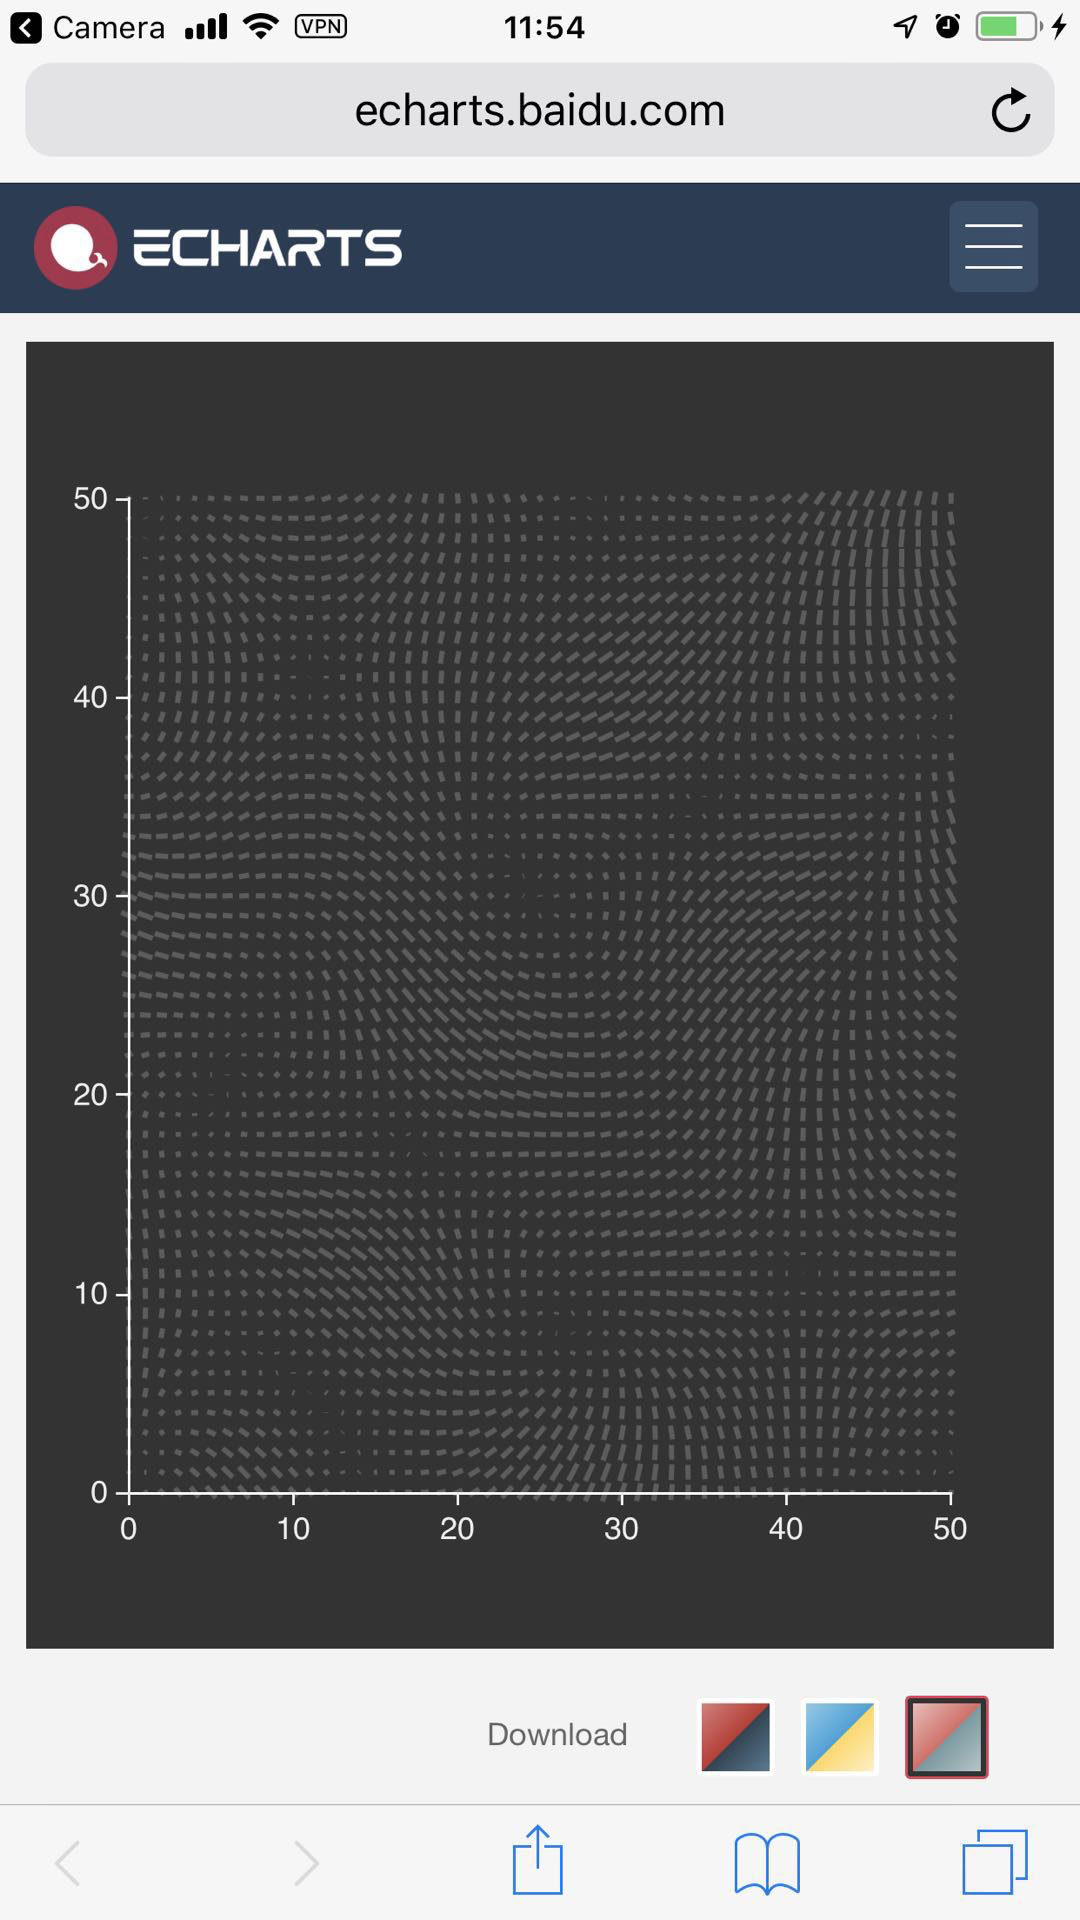
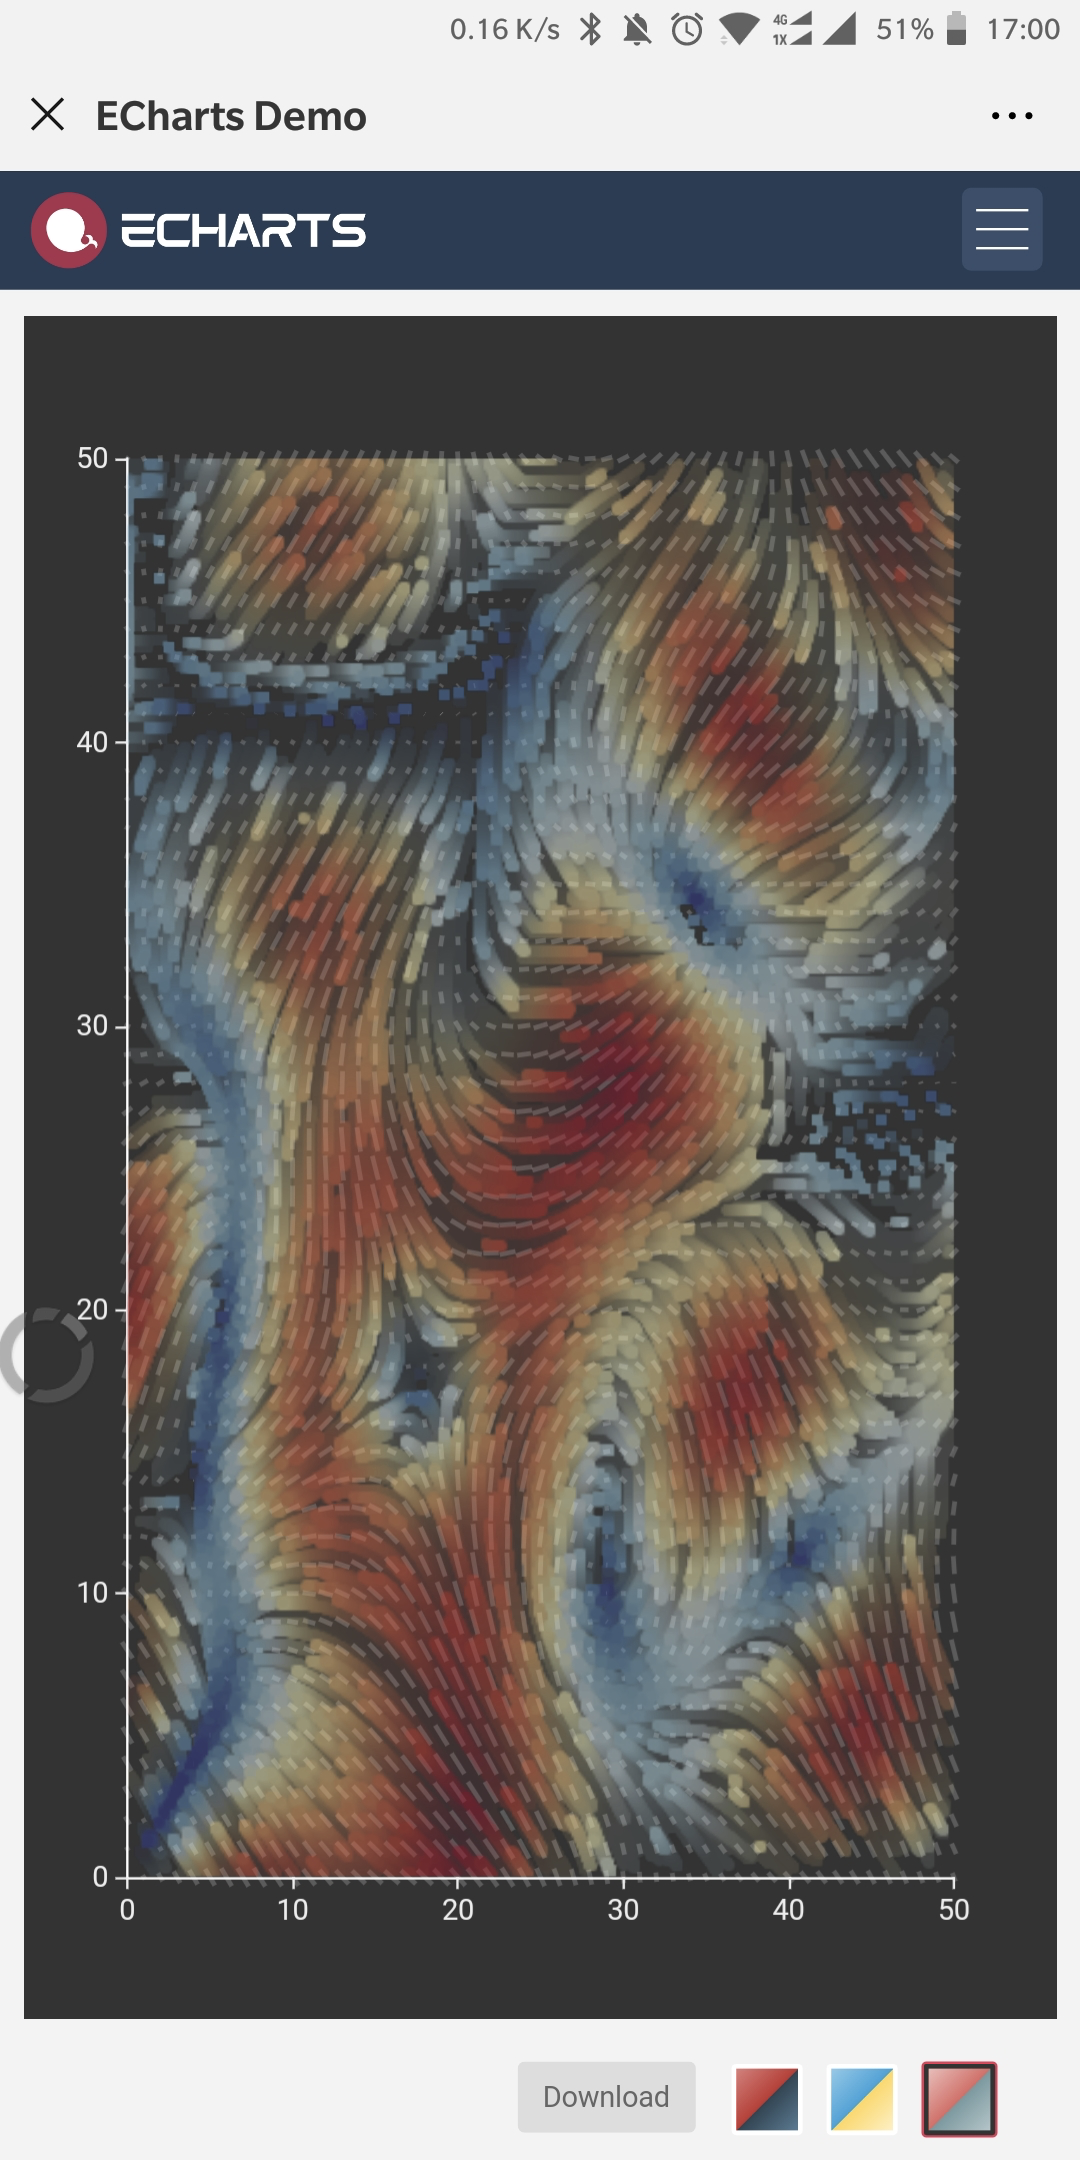
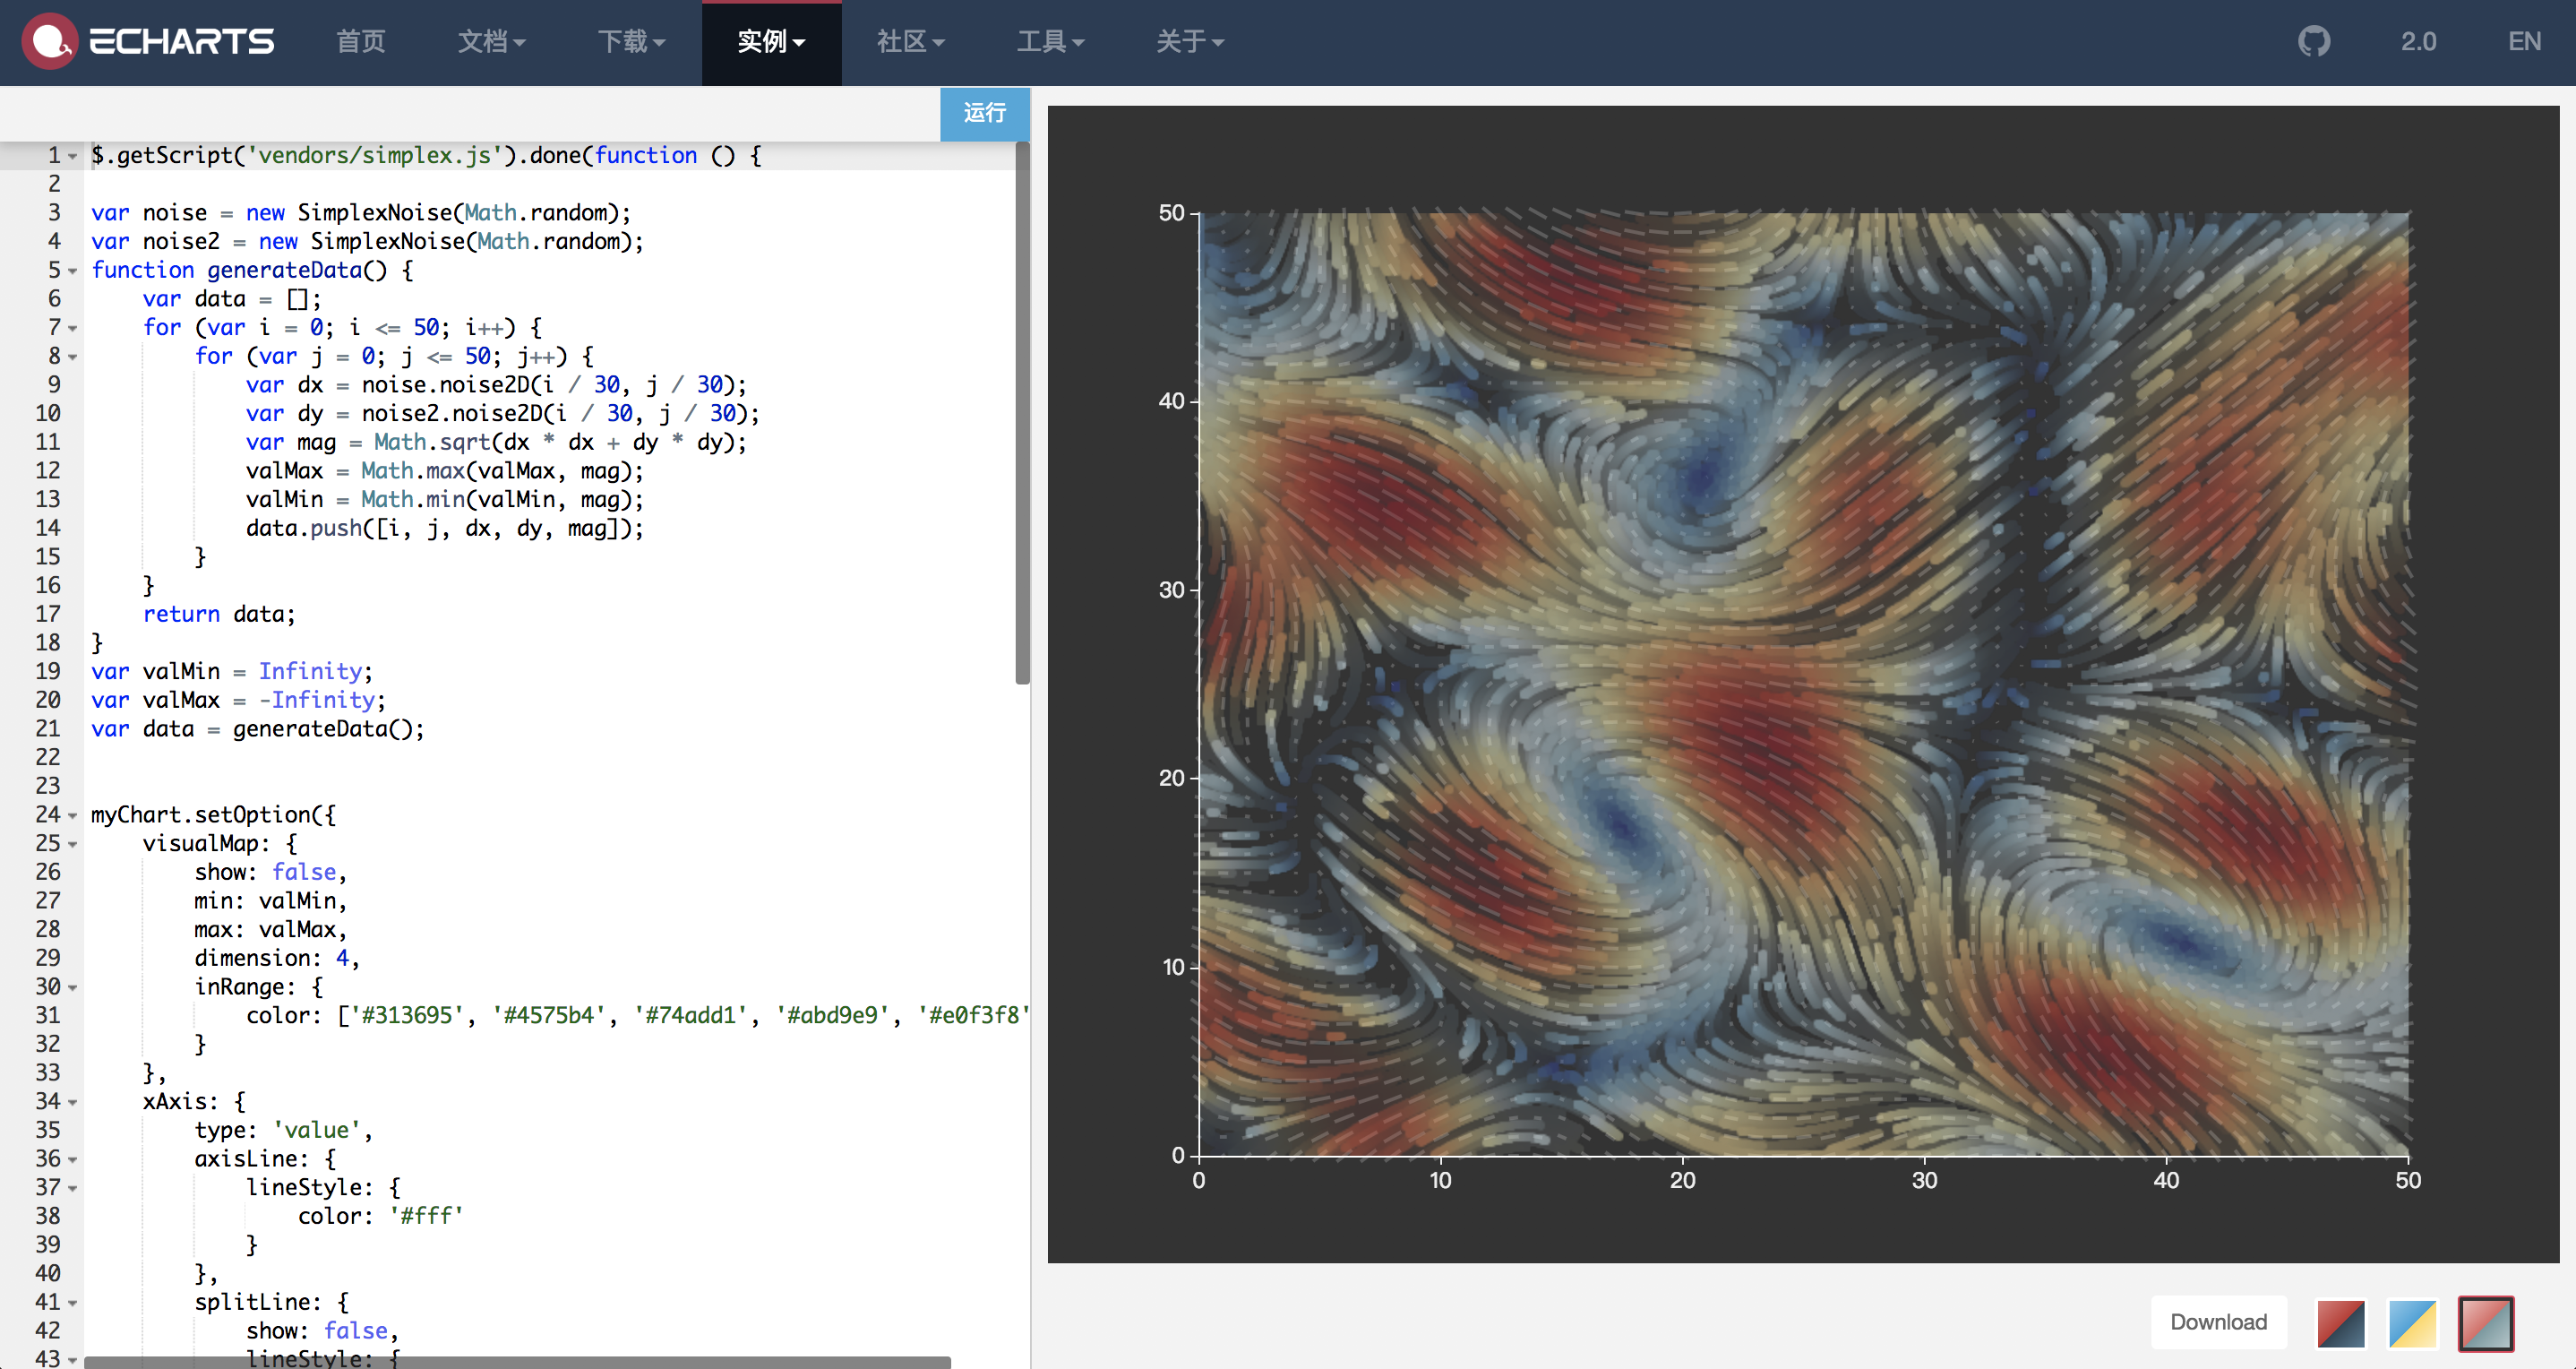
[GitHub] iboying opened a new issue #9189: FlowGL 矢量场图在 iPhone 主流浏览器上无法显示
iboying opened a new issue #9189: FlowGL 矢量场图在 iPhone 主流浏览器上无法显示
URL: https://github.com/apache/incubator-echarts/issues/9189
### One-line summary [问题简述]
【GL 矢量场图】在 iPhone 主流浏览器上无法显示,Android 手机浏览器和PC端浏览器可正常访问。
### Version & Environment [版本及环境]
+ ECharts version [ECharts 版本]: echarts 2.0
+ Browser version [浏览器类型和版本]: iPhone safari、iPhone chrome、iPhone 微信浏览器
+ OS Version [操作系统类型和版本]: iPhone、iOS 12.0
### Expected behaviour [期望结果]
iPhone 访问官网 GL 矢量场图 能看到效果。
### ECharts option [ECharts配置项]
```javascript
option = {
}
```
此处使用官网示例的代码即可;
### Other comments [其他信息]
官网示例即可查看:
http://www.echartsjs.com/examples/editor.html?c=flowGL-noise=1=dark
iPhone Safari查看效果:
Android 微信查看效果:
Mac chrome 查看效果:
This is an automated message from the Apache Git Service.
To respond to the message, please log on GitHub and use the
URL above to go to the specific comment.
For queries about this service, please contact Infrastructure at:
us...@infra.apache.org
With regards,
Apache Git Services
-
To unsubscribe, e-mail: dev-unsubscr...@echarts.apache.org
For additional commands, e-mail: dev-h...@echarts.apache.org
[GitHub] ramarro123 opened a new issue #9188: tooltip formatter when using axis trigger
ramarro123 opened a new issue #9188: tooltip formatter when using axis trigger
URL: https://github.com/apache/incubator-echarts/issues/9188


   hello,

   if i use a
chart.tooltip = {
 trigger: 'axis'
   };

   and

  chart.tooltip.formatter = function (params) {}

   how can i detect what's the current item on params array?
   params array have all the data from chart, so if i have 100 data, i have 100
items.

   i am using a dataset+line with custom renderer here, and i need to have
custom formatter as well.

   let me know if i can detect the current index position (or the current X val
from cursor, whatever better suit)


This is an automated message from the Apache Git Service.
To respond to the message, please log on GitHub and use the
URL above to go to the specific comment.

For queries about this service, please contact Infrastructure at:
us...@infra.apache.org


With regards,
Apache Git Services

-
To unsubscribe, e-mail: dev-unsubscr...@echarts.apache.org
For additional commands, e-mail: dev-h...@echarts.apache.org
[GitHub] ramarro123 commented on issue #9183: try to make echarts international
ramarro123 commented on issue #9183: try to make echarts international
URL:
https://github.com/apache/incubator-echarts/issues/9183#issuecomment-428493804


   now i am on osx, but basically it shows little square


This is an automated message from the Apache Git Service.
To respond to the message, please log on GitHub and use the
URL above to go to the specific comment.

For queries about this service, please contact Infrastructure at:
us...@infra.apache.org


With regards,
Apache Git Services

-
To unsubscribe, e-mail: dev-unsubscr...@echarts.apache.org
For additional commands, e-mail: dev-h...@echarts.apache.org
[GitHub] Vvvickie commented on issue #9171: fix #8009 & #5969, symbol symbolSize and opacity setting for category itemStyle in graph
Vvvickie commented on issue #9171: fix #8009 & #5969, symbol symbolSize and
opacity setting for category itemStyle in graph
URL:
https://github.com/apache/incubator-echarts/pull/9171#issuecomment-428487430


   Completed, please check again : )


This is an automated message from the Apache Git Service.
To respond to the message, please log on GitHub and use the
URL above to go to the specific comment.

For queries about this service, please contact Infrastructure at:
us...@infra.apache.org


With regards,
Apache Git Services

-
To unsubscribe, e-mail: dev-unsubscr...@echarts.apache.org
For additional commands, e-mail: dev-h...@echarts.apache.org
[GitHub] DongJoon-Ko opened a new issue #9187: Performance is poor if series has a lot of data
DongJoon-Ko opened a new issue #9187: Performance is poor if series has a lot
of data
URL: https://github.com/apache/incubator-echarts/issues/9187


   ### One-line summary [问题简述]

   Performance is very poor if there is a lot of legend data(
   Approximately 200 or more).
   No matter what the behavior is(mouseover tooltip, click magictype, click
legend, ... all of chart division), performance is poor.
   If the data is small, the performance is normal.


   ### Version & Environment [版本及环境]
   + ECharts version [ECharts 版本]:
   + Browser version [浏览器类型和版本]:
   + OS Version [操作系统类型和版本]:


   ### Expected behaviour [期望结果]


   ### ECharts option [ECharts配置项]


   ```javascript
   option = {

   }

   ```


   ### Other comments [其他信息]


This is an automated message from the Apache Git Service.
To respond to the message, please log on GitHub and use the
URL above to go to the specific comment.

For queries about this service, please contact Infrastructure at:
us...@infra.apache.org


With regards,
Apache Git Services

-
To unsubscribe, e-mail: dev-unsubscr...@echarts.apache.org
For additional commands, e-mail: dev-h...@echarts.apache.org
[GitHub] DiegooChen commented on issue #8897: options.title.textStyle properties don't work
DiegooChen commented on issue #8897: options.title.textStyle properties don't
work
URL:
https://github.com/apache/incubator-echarts/issues/8897#issuecomment-428463160


   Use `left:'center'` instead, although its very strange, I believe it was the
old version code that work but echart help documents updated.


   `title: {
 text:'Title should be centered',
 left:'center',
   },
   `


This is an automated message from the Apache Git Service.
To respond to the message, please log on GitHub and use the
URL above to go to the specific comment.

For queries about this service, please contact Infrastructure at:
us...@infra.apache.org


With regards,
Apache Git Services

-
To unsubscribe, e-mail: dev-unsubscr...@echarts.apache.org
For additional commands, e-mail: dev-h...@echarts.apache.org
[GitHub] HWtest001 commented on issue #9185: 鼠标上移到饼图图例上时,饼块除了高亮,如何弹出提示信息
HWtest001 commented on issue #9185: 鼠标上移到饼图图例上时,饼块除了高亮,如何弹出提示信息
URL:
https://github.com/apache/incubator-echarts/issues/9185#issuecomment-428457429


   后面版本会增加图例的mouseover事件接口吗?


This is an automated message from the Apache Git Service.
To respond to the message, please log on GitHub and use the
URL above to go to the specific comment.

For queries about this service, please contact Infrastructure at:
us...@infra.apache.org


With regards,
Apache Git Services

-
To unsubscribe, e-mail: dev-unsubscr...@echarts.apache.org
For additional commands, e-mail: dev-h...@echarts.apache.org