[GitHub] [echarts] slindersAmsterdam opened a new issue, #18201: using dataset + encode.itemGroupID doesnt seem te work for Drilldown pie chart
slindersAmsterdam opened a new issue, #18201:
URL: https://github.com/apache/echarts/issues/18201

   ### Version

   52.2

   ### Link to Minimal Reproduction

   _No response_

   ### Steps to Reproduce

   The drilldown function doesnt work with encode. When 'data' gets activated,
it does work.

   ---

   var container = document.getElementById('main');
   var chart = echarts.init(container);


   const RV = [['met', 52],['zonder', 14]];
   const RA = [['met', 6], ['zonder', 10]];
   const GL = [['met', 6], ['zonder', 1]];
   const vri = [   ['RV', 5, 'A'],   ['RA', 2,  'B'],   ['GL', 40,  'C'] ];

   chart.setOption({
 tooltip: {trigger: 'item'},
 dataset: [
   {
 dimensions: ['status', 'waarde', 'groupId'],
 source: vri
   }
 ],

 series: [
   {
 label: {show: false},
 emphasis: {label: {show: true,fontSize: 40, fontWeight: 'bold'}
 },
 type: 'pie',
 radius: ['35%', '65%'],
 center: ['50%', '55%'],
 id: "vri",
   //- itemgroupID doesn't seem to work in encode, drilldownfunction does
not work
 encode: {
   itemName: 'status',
   value: 'waarde',
   tooltip: ['status', 'waarde','groupId'],
   itemGroupID: 'groupId',
 },

   //- groupID directly in data does work, drilldownfunction is active
   // data: [
   //   { value: 5, groupId: 'A', name: 'RV' },
   //   {value: 2, groupId: 'B', name: 'RA'},
   //   {value: 40, groupId: 'C', name: 'GL'}]

   },]}

   );

   const drilldownData = [
 { dataGroupId: 'A', data: RV},
 { dataGroupId: 'B', data: RA},
 { dataGroupId: 'C', data:GL}
   ];

   mychart.on("click", function (event) {
 console.log(event)
 if (event.data) {
   var subData = drilldownData.find(function (data) {
 return data.dataGroupId === event.data.groupId;
   });
   if (!subData) {
 return;
   }
   myChart.setOption({
 series: {
   type: "pie",
   radius: ['35%', '65%'],
   center: ['50%', '55%'],
   id: "test",
   dataGroupId: subData.dataGroupId,
   data: subData.data.map(function (item) {
 return {
   value: item[1],
   groupId: item[0],
   name: item[0],
 };
   }),
   universalTransition: {
 enabled: true,
 divideShape: "clone",
   },
 },
 graphic: [
   {
 type: "text", left: 50, top: 20,
 style: {text: "terug",fontSize: 18},
 onclick: function () {myChart.setOption(option, true);
 },
   },
 ],
   });}
   });
   // return option

   ### Current Behavior

   The drilldown function for this pie works when groupid is included directly
in data:

 data: [
  {value: 5, groupId: 'A', name: 'RV' },
  {value: 2, groupId: 'B', name: 'RA'},
  {value: 40, groupId: 'C', name: 'GL'}]

   It doesnt seem to work when dataset is used (instead of data) and groupId is
included in encode:

 encode: {
   itemName: 'status',
   value: 'waarde',
   tooltip: ['status', 'waarde','groupId'],
   itemGroupID: 'groupId',
 },

   ### Expected Behavior

   The drilldown function should work based on a dataset.

   ### Environment

   ```markdown
   - OS:
   - Browser:
   - Framework:
   ```


   ### Any additional comments?

   I copied the code to codepen but I get an error:
   'ReferenceError: mychart is not defined'
   https://codepen.io/slindersAmsterdam/pen/yLqpbLX


--
This is an automated message from the Apache Git Service.
To respond to the message, please log on to GitHub and use the
URL above to go to the specific comment.

To unsubscribe, e-mail: commits-unsubscr...@echarts.apache.org.apache.org

For queries about this service, please contact Infrastructure at:
us...@infra.apache.org


-
To unsubscribe, e-mail: commits-unsubscr...@echarts.apache.org
For additional commands, e-mail: commits-h...@echarts.apache.org
[GitHub] [echarts] infacto opened a new issue, #18200: [Bug] Type issue: Property x,y,width,height does not exist on type CustomSeriesRendererItemParamsCoordSys
infacto opened a new issue, #18200:
URL: https://github.com/apache/echarts/issues/18200

   ### Version

   5.4.1

   ### Link to Minimal Reproduction

   https://echarts.apache.org/examples/en/editor.html?c=custom-profile

   ### Steps to Reproduce

   Check out the link above. It's one of the examples of ECharts. Thanks btw.
It's a great chart lib and deserves more attention as chart.js in my opinion.
Anyway...

   I just copied the example code and added some types for TypeScript by
checking what types are expected here.


   ### Current Behavior

   For the renderItem method argument params `CustomSeriesRenderItemParams`, I
get the error that `params.coordSys.x` (also `y`, `width` and `height` do not
exsit on that type.) But at runtime it works. Maybe a type issue? Or is there
another derived type I should use?


   ### Expected Behavior

   Types should work well for a library written in TypeScript. What is great
btw.

   Workaround: Modify (extend) type or use `any` or `unknown`. Not the best
solution.

   ### Environment

   ```markdown
   - OS: Win 10 Pro 64-bit 22H2
   - Browser: Chrome 109
   - Framework: TypeScript (Angular)
   ```


   ### Any additional comments?

   No matter, but I use [echarts](https://www.npmjs.com/package/echarts)
directly in Angular. (Not
[ngx-echarts](https://www.npmjs.com/package/ngx-echarts).)


--
This is an automated message from the Apache Git Service.
To respond to the message, please log on to GitHub and use the
URL above to go to the specific comment.

To unsubscribe, e-mail: commits-unsubscr...@echarts.apache.org.apache.org

For queries about this service, please contact Infrastructure at:
us...@infra.apache.org


-
To unsubscribe, e-mail: commits-unsubscr...@echarts.apache.org
For additional commands, e-mail: commits-h...@echarts.apache.org
[GitHub] [echarts] infacto opened a new issue, #18199: [Improvement] Canvas willReadFrequently warning.
infacto opened a new issue, #18199:
URL: https://github.com/apache/echarts/issues/18199

   ### What problem does this feature solve?

   No bug, no feature. Just something I see on console (Chrome 109):

   > Canvas2D: Multiple readback operations using getImageData are faster with
the willReadFrequently attribute set to true. See:
https://html.spec.whatwg.org/multipage/canvas.html#concept-canvas-will-read-frequently

   ### What does the proposed API look like?

   I have no idea. I just wanted to report this. Maybe we find a solution?


--
This is an automated message from the Apache Git Service.
To respond to the message, please log on to GitHub and use the
URL above to go to the specific comment.

To unsubscribe, e-mail: commits-unsubscr...@echarts.apache.org.apache.org

For queries about this service, please contact Infrastructure at:
us...@infra.apache.org


-
To unsubscribe, e-mail: commits-unsubscr...@echarts.apache.org
For additional commands, e-mail: commits-h...@echarts.apache.org
[GitHub] [echarts] infacto opened a new issue, #18198: [Feature] Change theme / dark mode dynamically.
infacto opened a new issue, #18198:
URL: https://github.com/apache/echarts/issues/18198

   ### What problem does this feature solve?

   Currently you can only pass the theme name to the init method.

   ### What does the proposed API look like?

   It would be great if we have a method to change the theme (by name). There
is a "darkMode" option. But this is only the half of a real dark mode.

   Use case:
   Your page allows user to switch dark mode dynamically by a button or select
list. All the content of the page immediately changes their look. In general by
CSS. The echarts chart is a bit more work to implement that. I with it could be
done simpler.


--
This is an automated message from the Apache Git Service.
To respond to the message, please log on to GitHub and use the
URL above to go to the specific comment.

To unsubscribe, e-mail: commits-unsubscr...@echarts.apache.org.apache.org

For queries about this service, please contact Infrastructure at:
us...@infra.apache.org


-
To unsubscribe, e-mail: commits-unsubscr...@echarts.apache.org
For additional commands, e-mail: commits-h...@echarts.apache.org
[GitHub] [echarts] helgasoft commented on issue #18194: [Bug] Duplicate Id=0 on multiple svg charts (IBM Accessibility Issue: 4.1.1)
helgasoft commented on issue #18194:
URL: https://github.com/apache/echarts/issues/18194#issuecomment-1398046982

   there is an [**id**
property](https://echarts.apache.org/en/option.html#series-gauge.id), but even
if set,  it does not show up  anywhere apparently ... (?!)


--
This is an automated message from the Apache Git Service.
To respond to the message, please log on to GitHub and use the
URL above to go to the specific comment.

To unsubscribe, e-mail: commits-unsubscr...@echarts.apache.org

For queries about this service, please contact Infrastructure at:
us...@infra.apache.org


-
To unsubscribe, e-mail: commits-unsubscr...@echarts.apache.org
For additional commands, e-mail: commits-h...@echarts.apache.org
[GitHub] [echarts] helgasoft commented on issue #18196: [Bug] Rich text in legend does not inherit color from legend configuration if theme specifies `textStyle.color`
helgasoft commented on issue #18196:
URL: https://github.com/apache/echarts/issues/18196#issuecomment-1398026160

   Observations are correct, but an easy fix is to just set **bold.color** to
_'red'_ instead of relying on inheritance.


--
This is an automated message from the Apache Git Service.
To respond to the message, please log on to GitHub and use the
URL above to go to the specific comment.

To unsubscribe, e-mail: commits-unsubscr...@echarts.apache.org

For queries about this service, please contact Infrastructure at:
us...@infra.apache.org


-
To unsubscribe, e-mail: commits-unsubscr...@echarts.apache.org
For additional commands, e-mail: commits-h...@echarts.apache.org
[GitHub] [echarts] helgasoft opened a new issue, #18197: [Bug] drilldown chart problems with specific data in datasets
helgasoft opened a new issue, #18197:
URL: https://github.com/apache/echarts/issues/18197

   ### Version

   5.4.1

   ### Link to Minimal Reproduction

   [all
dataset](https://echarts.apache.org/examples/en/editor.html?c=bar-drilldown&code=PTAEBMEMBdIZwKbVAaggJwJYBtsFopZFkA3BdOTAewDsAoKgB2mptAF5QBvO0UADwCC_THABc3UNACejBBIDkAYxgIA5lXTSFoAL4AaXqGnDRErgaOF4SCQG0efPnCoBXdEvmg7Rp94UkkNiuCAr6oApq6G6MAJLgCgC6hn58dgCs4QqQNJgAtkFwSSmpdgBMWQBm6K6Y0EXJvk52ACxZKhTFTYlGuo18OfkwrAAi7sO0AKqMhF7pAAzzJYhYCOLcTTJyigBGkOhhTZjginBBa4d-CDRKVOBeXPxiAIzh0mJLoHUIeQDi0a44icIlEYvEFJY_LdsJoAELvCLWS5OVy5MgUIIAFXQOUoLFo5iafGukB22AQwOgNQQJT84EwJGOCAAygALSDbCJKGE0UJNXS9Oi6ADcdDotxocGQ4CwuBGMBsyE4DiMLncnnsTTskQBQLCEUCwVCWWs_zBCX6zQUAGEYEVwm0IoMCtgGrT_CMqGp7aAKk7ci63VqbVQAO4-17-oaurp-bVshAIRj6v3ZAOFWNWgAKmG9-sjaejQbjCkEjEY5J9joU1Vq9UzaQUAHkcTQ1Bdwqna3Vi1bMVRpFRYPrqx1e42m3JsCn2vtx_4xyPR3Pik4QKBIOB7uBgwA1KjYADWcFDkHbNBnXJXPT4PUsjlAACIqbjKpo8o_CX5n7IEJ-n5UODQOQj7uo-EqAWo_4Pt-9J5NclC0P-j6mrq8SgUST7sMhAAygiPvygp9KKdB5NI1rsug0AAHS0AAFMo2CYEoh76pUqJKPibB0QgZA0NAACUGx8JglSgDxfE0TQkDwUJMEYDg2DykQSB2HYzyJIk1EvpKb7oHk1EQbmdgAAbsCZiQcKAvHXFJMkIKKfhkRR-w0cQk5cXR8l8EIIjrFwUi_oo

KjARoWg6JCqTWMQEgyopymKu6zjkJgaxfqkfBbF4Ch7AcSVOMcpznPamF8NFSCxDQ9xPKAryldZNx3A8TyfO8kbfH8aHAgoqHmhC-V8KiDLkGc2DYridSsOlGXEtJZIUhIVIhANTj0oy9xshy2XcrQfIzXomGRX4UQcqyzGavt3mpFlijAfw0DIvt5KVNAEgLCtmVMBIZRLPVzgyOS037VICD3YosKQCxj3A2-_HMpgABeXjPAAHH9egfaAtDcsxh4SOxNxceJcno3wzmUW5SAeawdFMFx-hLQgAnCqAIDhFw6BJtgkMIAAsuQ7anClFy6Mz6MCvtEupDeTii45B1y0AA)

   ### Steps to Reproduce

   two code examples

   - [all
dataset](https://echarts.apache.org/examples/en/editor.html?c=bar-drilldown&code=PTAEBMEMBdIZwKbVAaggJwJYBtsFopZFkA3BdOTAewDsAoKgB2mptAF5QBvO0UADwCC_THABc3UNACejBBIDkAYxgIA5lXTSFoAL4AaXqGnDRErgaOF4SCQG0efPnCoBXdEvmg7Rp94UkkNiuCAr6oApq6G6MAJLgCgC6hn58dgCs4QqQNJgAtkFwSSmpdgBMWQBm6K6Y0EXJvk52ACxZKhTFTYlGuo18OfkwrAAi7sO0AKqMhF7pAAzzJYhYCOLcTTJyigBGkOhhTZjginBBa4d-CDRKVOBeXPxiAIzh0mJLoHUIeQDi0a44icIlEYvEFJY_LdsJoAELvCLWS5OVy5MgUIIAFXQOUoLFo5iafGukB22AQwOgNQQJT84EwJGOCAAygALSDbCJKGE0UJNXS9Oi6ADcdDotxocGQ4CwuBGMBsyE4DiMLncnnsTTskQBQLCEUCwVCWWs_zBCX6zQUAGEYEVwm0IoMCtgGrT_CMqGp7aAKk7ci63VqbVQAO4-17-oaurp-bVshAIRj6v3ZAOFWNWgAKmG9-sjaejQbjCkEjEY5J9joU1Vq9UzaQUAHkcTQ1Bdwqna3Vi1bMVRpFRYPrqx1e42m3JsCn2vtx_4xyPR3Pik4QKBIOB7uBgwA1KjYADWcFDkHbNBnXJXPT4PUsjlAACIqbjKpo8o_CX5n7IEJ-n5UODQOQj7uo-EqAWo_4Pt-9J5NclC0P-j6mrq8SgUST7sMhAAygiPvygp9KKdB5NI1rsug0AAHS0AAFMo2CYEoh76pUqJKPibB0QgZA0NAACUGx8JglSgDxfE0TQkDwUJMEYDg2DykQSB2HYzyJIk1EvpKb7oHk1EQbmdgAAbsCZiQcKAvHXFJMkIKKfhkRR-w0cQk5cXR8l8EIIjrFwUi_

ooKjARoWg6JCqTWMQEgyopymKu6zjkJgaxfqkfBbF4Ch7AcSVOMcpznPamF8NFSCxDQ9xPKAryldZNx3A8TyfO8kbfH8aHAgoqHmhC-V8KiDLkGc2DYridSsOlGXEtJZIUhIVIhANTj0oy9xshy2XcrQfIzXomGRX4UQcqyzGavt3mpFlijAfw0DIvt5KVNAEgLCtmVMBIZRLPVzgyOS037VICD3YosKQCxj3A2-_HMpgABeXjPAAHH9egfaAtDcsxh4SOxNxceJcno3wzmUW5SAeawdFMFx-hLQgAnCqAIDhFw6BJtgkMIAAsuQ7anClFy6Mz6MCvtEupDeTii45B1y0AA)

   - [dataset + drill
series.data](https://echarts.apache.org/examples/en/editor.html?c=bar-drilldown&code=PTAEBMEMBdIZwKbVAaggJwJYBtukVgnAHRSygBuC6cmA9gHYBQdADtPQ6ALygDeTUKAAeAQWGY4ALn6hoAT1YIZAcgDGMBAHM66eStABfADSDQ88ZJl8TZsvCQyA2gKFC4dAK7o1y0E7M3fxUKSGxPBBVjUBUtdC9WAElwFQBdUyChJwBWaJVIBkwAWzC4NIzMpwAmPIAzdE9MaDL0wLcnABY8jRpyttSzQ1ahAuKYTgARb3HGAFVWMj9sgAZlioJMIms2hSVVACNIdCi2zHBVODCiE6CEBjU6cD8-YSkARmj5KTXQJoQigDi8U8SXOMTiCWSKlsQQe2F0ACEvjF7Dc3J5ClQaGEACroAq0DiMbaZUB3SD7bAIMHQBoICpBcCYChnBAAZQAFpA9jE1PCGJE2oZBkxDABuJgPBhwZDgLC4cB0ADuDAmMEgPH8ZlcbnsQMhYPyhRK2DKDIg6ucbSyKgAwjAzaAOsNKioJnQtI6qi6gk47crHW8fe0VJyEAhWFFQN7zTaAAqYT1RoP9QYVHVCPXA0GqeqNZpozOWrWkv2iVisKmO52x4IAeXxDC012i3tTQhh_DaWYNqh6Zu7xYCpZUOLo8josCjNet9aU2CjMdnfv7i5jbhAoEg4Ce4GXKgAanRsABrOBKyDNhiLgZBW9GJipCVMIryW1c9DQYiMAAU6mwmBqCeUa1BiahElwP4IFQDDQAAlF2QiYLUoBQTBX72AhGaUEc-CePsarkLwco4NgioqoRkDELUmAMOAP6gfcEGoZhiGZOgSDeFw9ikOq-ogskPDcLw0F3F-DCQEUCBiqAIA8RCAngBKQSGHByluMhqEAIRwPhlFYbOHHQFx6kdm0r7vkcX6INAdbsJwP7YUIYgSNIbGk

vYMi6QR6q8bAxAlKwDFgcxP5_EUBmkkERlcb80D_E4yxPrOHZwbOnZBBsWzuZkux-CohzHLWSGGpcVaFpkPaKV5em-VVoLFRasA1T5_k8YFwVMZwqHhZFUVCDF6BcOFThBqZmSqY1GLMtQZV4gSTScCS_VkhJlLUjItIRI1mbMqynLcvlfKMIK_XCqSGVuHE3IcoBVr9U5uWKPl8XCNAFWklStTQDIKw7XIbAyFUawpW4MryFSy0rXICBvaoCKQEBH1RbUjDQGymAAF5-G8AAcoMdv9jB8oBJ4yIx4HdT-fXQ5uCNARAdBEKADCTqASq6Ce7NNByXjIBxlaI7RWioVtCAIQA_FpBNuBZH7WUgdkQT-bAQdEYtqTL51Rdrd5CprZmqWKQA)


   ### Current Behavior

   Stumbled on this by doing state-to-county drilldown. Turns out the US
**states** of Arkansas, Hawaii, Oklahoma have **counties** with the same names.
   To replicate I updated the [ECharts
example](https://echarts.apache.org/examples/en/editor.html?c=bar-drilldown) by
adding an extra record in **cars**.
   1) click on the _cars_ bar: the actual drilldown works fine, except the
**morphing** is not right - _cars_ clones to _cars_ only instead of cloning to
all (Toyota,Opel,cars,Volkswagen).
   2) press the Back button to return to the higher level bars. A more serious
problem appears - the _cars_ bar is **misplaced**. Look
[GitHub] [echarts] Skuperday commented on issue #17858: Bar charts not clipped when using filterMode: 'none'
Skuperday commented on issue #17858:
URL: https://github.com/apache/echarts/issues/17858#issuecomment-1397902071

   Hello there! I ran into a same trouble a couple of days ago and found a
solution how to use a bar chart and line chart so that the filtering does not
cut off the data. This solved my problem with dataZoom
   All that is needed is to change the weakFilter behavior logic in the
sources. For a line chart, using filters causes problems when 1-2 points
remain, but @cfwang123 was able to find a solution to the problem of filter
behavior, I suggest using the old filter for the bar chart, and in all other
situations, the modified filter @cfwang123
   from:
   `var thisLeftOut = value < valueWindow[0];`
`var thisRightOut = value > valueWindow[1]; `
   to:
   `if(seriesModel.subType === 'bar') {`
   `var thisLeftOut = value < valueWindow[0];`
   `var thisRightOut = value > valueWindow[1];`
   `} else {`
   `var thisLeftOut = value < valueWindow[0] && seriesData.get(dataDims[i],
dataIndex+1) < valueWindow[0];`
   `var thisRightOut = value > valueWindow[1] &&
seriesData.get(dataDims[i], dataIndex-1) > valueWindow[1];`
   `}`


--
This is an automated message from the Apache Git Service.
To respond to the message, please log on to GitHub and use the
URL above to go to the specific comment.

To unsubscribe, e-mail: commits-unsubscr...@echarts.apache.org

For queries about this service, please contact Infrastructure at:
us...@infra.apache.org


-
To unsubscribe, e-mail: commits-unsubscr...@echarts.apache.org
For additional commands, e-mail: commits-h...@echarts.apache.org
[GitHub] [echarts] juliepagano opened a new issue, #18196: [Bug] Rich text in legend does not inherit color from legend configuration if theme specifies `textStyle.color`
juliepagano opened a new issue, #18196:
URL: https://github.com/apache/echarts/issues/18196

   ### Version

   5.4.1

   ### Link to Minimal Reproduction

   https://codepen.io/juliepagano_cs/pen/XWBzLaJ

   ### Steps to Reproduce

   1. Open [the codepen](https://codepen.io/juliepagano_cs/pen/XWBzLaJ)
   2. Note that the non-rich text in the legend is red (the value specified in
`legend.textStyle.color`).
   3. Note that the rich text in the legend is green (the value specified in
the theme's `textStyle.color`).
   4. Click an item in the legend.
   5.  Note that the non-rich text in the legend is blue (the value specified
in `legend.inactiveColor`).
   6. Note that the rich text in the legend is green (the value specified in
the theme's `textStyle.color`).
   7. Comment out the `textStyle.color` in the theme and note that the rich and
non-rich text match the legend configuration.

   ### Current Behavior

   When a chart's theme specifies `textStyle.color`, rich text within the
legend configuration inherits from the theme's text color instead of the colors
configured in the legend.

   ### Expected Behavior

   I would expect rich text within a legend to inherit from the legend's color
configuration (`legend.textStyle.color` when active and `legend.inactiveColor`
when inactive).

   ### Environment

   ```markdown
   - OS: macOS Monterey
   - Browser: Chrome 108.0.5359.124
   - Framework: the bug is not framework specific, but we are working in React
   ```


   ### Any additional comments?

   _No response_


--
This is an automated message from the Apache Git Service.
To respond to the message, please log on to GitHub and use the
URL above to go to the specific comment.

To unsubscribe, e-mail: commits-unsubscr...@echarts.apache.org.apache.org

For queries about this service, please contact Infrastructure at:
us...@infra.apache.org


-
To unsubscribe, e-mail: commits-unsubscr...@echarts.apache.org
For additional commands, e-mail: commits-h...@echarts.apache.org
[GitHub] [echarts] twoco opened a new issue, #18195: [Feature] Zoom reset by button and/or double click.
twoco opened a new issue, #18195: URL: https://github.com/apache/echarts/issues/18195 ### What problem does this feature solve? Reset dataZoom slide by e.g. double click and / or a button. Currently you have to drag both handles to their ends to reset the zoom. 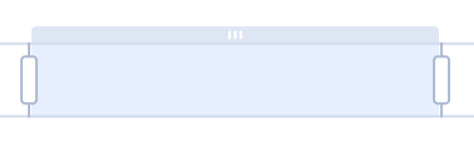 ### What does the proposed API look like? Maybe a property to the options of the `dataZoom`? Maybe enabled by default? Something like `resetButton` and/or `resetGestures` or `resetDbClick`. -- This is an automated message from the Apache Git Service. To respond to the message, please log on to GitHub and use the URL above to go to the specific comment. To unsubscribe, e-mail: commits-unsubscr...@echarts.apache.org.apache.org For queries about this service, please contact Infrastructure at: us...@infra.apache.org - To unsubscribe, e-mail: commits-unsubscr...@echarts.apache.org For additional commands, e-mail: commits-h...@echarts.apache.org
[GitHub] [echarts] github-actions[bot] closed issue #13959: 引力导图中设置的roam:true,开启鼠标平移,怎么监听这个平移事件
github-actions[bot] closed issue #13959: 引力导图中设置的roam:true,开启鼠标平移,怎么监听这个平移事件
URL: https://github.com/apache/echarts/issues/13959


--
This is an automated message from the Apache Git Service.
To respond to the message, please log on to GitHub and use the
URL above to go to the specific comment.

To unsubscribe, e-mail: commits-unsubscr...@echarts.apache.org

For queries about this service, please contact Infrastructure at:
us...@infra.apache.org


-
To unsubscribe, e-mail: commits-unsubscr...@echarts.apache.org
For additional commands, e-mail: commits-h...@echarts.apache.org
[GitHub] [echarts] github-actions[bot] commented on issue #13959: 引力导图中设置的roam:true,开启鼠标平移,怎么监听这个平移事件
github-actions[bot] commented on issue #13959:
URL: https://github.com/apache/echarts/issues/13959#issuecomment-1397609306

   This issue has been automatically closed because it did not have recent
activity. If this remains to be a problem with the latest version of Apache
ECharts, please open a new issue and link this to it. Thanks!


--
This is an automated message from the Apache Git Service.
To respond to the message, please log on to GitHub and use the
URL above to go to the specific comment.

To unsubscribe, e-mail: commits-unsubscr...@echarts.apache.org

For queries about this service, please contact Infrastructure at:
us...@infra.apache.org


-
To unsubscribe, e-mail: commits-unsubscr...@echarts.apache.org
For additional commands, e-mail: commits-h...@echarts.apache.org
[GitHub] [echarts] github-actions[bot] closed issue #14019: map geo is not realy width
github-actions[bot] closed issue #14019: map geo is not realy width
URL: https://github.com/apache/echarts/issues/14019


--
This is an automated message from the Apache Git Service.
To respond to the message, please log on to GitHub and use the
URL above to go to the specific comment.

To unsubscribe, e-mail: commits-unsubscr...@echarts.apache.org

For queries about this service, please contact Infrastructure at:
us...@infra.apache.org


-
To unsubscribe, e-mail: commits-unsubscr...@echarts.apache.org
For additional commands, e-mail: commits-h...@echarts.apache.org
[GitHub] [echarts] github-actions[bot] commented on issue #14063: 构建了兼容IE8 echarts5.0.1版本,但是运行报错You need to require 'zrender/vml/vml' to support IE8,如何解决
github-actions[bot] commented on issue #14063:
URL: https://github.com/apache/echarts/issues/14063#issuecomment-1397609502

   This issue has been automatically marked as stale because it did not have
recent activity. It will be closed in 7 days if no further activity occurs. If
you wish not to mark it as stale, please leave a comment in this issue.


--
This is an automated message from the Apache Git Service.
To respond to the message, please log on to GitHub and use the
URL above to go to the specific comment.

To unsubscribe, e-mail: commits-unsubscr...@echarts.apache.org

For queries about this service, please contact Infrastructure at:
us...@infra.apache.org


-
To unsubscribe, e-mail: commits-unsubscr...@echarts.apache.org
For additional commands, e-mail: commits-h...@echarts.apache.org
[GitHub] [echarts] github-actions[bot] commented on issue #14075: ECharts显示大量数据的时,X轴最左、最右的数据无法触发tooltip。
github-actions[bot] commented on issue #14075:
URL: https://github.com/apache/echarts/issues/14075#issuecomment-1397609545

   This issue has been automatically marked as stale because it did not have
recent activity. It will be closed in 7 days if no further activity occurs. If
you wish not to mark it as stale, please leave a comment in this issue.


--
This is an automated message from the Apache Git Service.
To respond to the message, please log on to GitHub and use the
URL above to go to the specific comment.

To unsubscribe, e-mail: commits-unsubscr...@echarts.apache.org

For queries about this service, please contact Infrastructure at:
us...@infra.apache.org


-
To unsubscribe, e-mail: commits-unsubscr...@echarts.apache.org
For additional commands, e-mail: commits-h...@echarts.apache.org
[GitHub] [echarts] github-actions[bot] commented on issue #14019: map geo is not realy width
github-actions[bot] commented on issue #14019:
URL: https://github.com/apache/echarts/issues/14019#issuecomment-1397609382

   This issue has been automatically closed because it did not have recent
activity. If this remains to be a problem with the latest version of Apache
ECharts, please open a new issue and link this to it. Thanks!


--
This is an automated message from the Apache Git Service.
To respond to the message, please log on to GitHub and use the
URL above to go to the specific comment.

To unsubscribe, e-mail: commits-unsubscr...@echarts.apache.org

For queries about this service, please contact Infrastructure at:
us...@infra.apache.org


-
To unsubscribe, e-mail: commits-unsubscr...@echarts.apache.org
For additional commands, e-mail: commits-h...@echarts.apache.org
[GitHub] [echarts] github-actions[bot] commented on issue #13985: Legend of pie chart showing anomalies
github-actions[bot] commented on issue #13985:
URL: https://github.com/apache/echarts/issues/13985#issuecomment-1397609340

   This issue has been automatically marked as stale because it did not have
recent activity. It will be closed in 7 days if no further activity occurs. If
you wish not to mark it as stale, please leave a comment in this issue.


--
This is an automated message from the Apache Git Service.
To respond to the message, please log on to GitHub and use the
URL above to go to the specific comment.

To unsubscribe, e-mail: commits-unsubscr...@echarts.apache.org

For queries about this service, please contact Infrastructure at:
us...@infra.apache.org


-
To unsubscribe, e-mail: commits-unsubscr...@echarts.apache.org
For additional commands, e-mail: commits-h...@echarts.apache.org
[GitHub] [echarts] github-actions[bot] closed issue #13857: 多折线图缓存和数据合并问题
github-actions[bot] closed issue #13857: 多折线图缓存和数据合并问题
URL: https://github.com/apache/echarts/issues/13857


--
This is an automated message from the Apache Git Service.
To respond to the message, please log on to GitHub and use the
URL above to go to the specific comment.

To unsubscribe, e-mail: commits-unsubscr...@echarts.apache.org

For queries about this service, please contact Infrastructure at:
us...@infra.apache.org


-
To unsubscribe, e-mail: commits-unsubscr...@echarts.apache.org
For additional commands, e-mail: commits-h...@echarts.apache.org
[GitHub] [echarts] github-actions[bot] commented on issue #13857: 多折线图缓存和数据合并问题
github-actions[bot] commented on issue #13857:
URL: https://github.com/apache/echarts/issues/13857#issuecomment-1397609223

   This issue has been automatically closed because it did not have recent
activity. If this remains to be a problem with the latest version of Apache
ECharts, please open a new issue and link this to it. Thanks!


--
This is an automated message from the Apache Git Service.
To respond to the message, please log on to GitHub and use the
URL above to go to the specific comment.

To unsubscribe, e-mail: commits-unsubscr...@echarts.apache.org

For queries about this service, please contact Infrastructure at:
us...@infra.apache.org


-
To unsubscribe, e-mail: commits-unsubscr...@echarts.apache.org
For additional commands, e-mail: commits-h...@echarts.apache.org
[GitHub] [echarts] github-actions[bot] commented on issue #12588: echart graph 关系图 自适应
github-actions[bot] commented on issue #12588:
URL: https://github.com/apache/echarts/issues/12588#issuecomment-1397609111

   This issue has been automatically marked as stale because it did not have
recent activity. It will be closed in 7 days if no further activity occurs. If
you wish not to mark it as stale, please leave a comment in this issue.


--
This is an automated message from the Apache Git Service.
To respond to the message, please log on to GitHub and use the
URL above to go to the specific comment.

To unsubscribe, e-mail: commits-unsubscr...@echarts.apache.org

For queries about this service, please contact Infrastructure at:
us...@infra.apache.org


-
To unsubscribe, e-mail: commits-unsubscr...@echarts.apache.org
For additional commands, e-mail: commits-h...@echarts.apache.org
[GitHub] [echarts] github-actions[bot] commented on issue #5888: 在vue中使用echarts,在tooltip中的formatter使用自定义html无法绑定组件内函数作为事件
github-actions[bot] commented on issue #5888:
URL: https://github.com/apache/echarts/issues/5888#issuecomment-1397609023

   This issue has been automatically closed because it did not have recent
activity. If this remains to be a problem with the latest version of Apache
ECharts, please open a new issue and link this to it. Thanks!


--
This is an automated message from the Apache Git Service.
To respond to the message, please log on to GitHub and use the
URL above to go to the specific comment.

To unsubscribe, e-mail: commits-unsubscr...@echarts.apache.org

For queries about this service, please contact Infrastructure at:
us...@infra.apache.org


-
To unsubscribe, e-mail: commits-unsubscr...@echarts.apache.org
For additional commands, e-mail: commits-h...@echarts.apache.org
[GitHub] [echarts] github-actions[bot] closed issue #5888: 在vue中使用echarts,在tooltip中的formatter使用自定义html无法绑定组件内函数作为事件
github-actions[bot] closed issue #5888:
在vue中使用echarts,在tooltip中的formatter使用自定义html无法绑定组件内函数作为事件
URL: https://github.com/apache/echarts/issues/5888


--
This is an automated message from the Apache Git Service.
To respond to the message, please log on to GitHub and use the
URL above to go to the specific comment.

To unsubscribe, e-mail: commits-unsubscr...@echarts.apache.org

For queries about this service, please contact Infrastructure at:
us...@infra.apache.org


-
To unsubscribe, e-mail: commits-unsubscr...@echarts.apache.org
For additional commands, e-mail: commits-h...@echarts.apache.org
[GitHub] [echarts] frankliu197 opened a new issue, #18194: [Bug] Duplicate Id=0 on multiple svg charts (IBM Accessibility Issue: 4.1.1)
frankliu197 opened a new issue, #18194: URL: https://github.com/apache/echarts/issues/18194 ### Version 5.3.2 ### Link to Minimal Reproduction https://codesandbox.io/embed/polished-monad-v0vopl?fontsize=14&hidenavigation=1&theme=dark ### Steps to Reproduce Inspect the html construct of the two graphs and see the following  Both graphs have a rect element with an ID of 0. ### Current Behavior If you create more than one graphs on the same page, there will be duplicate html tags with the same ID. The id attribute should be unique to provide machine-readable identifier for elements on the page. More on this accessibility issue: https://www.w3.org/WAI/WCAG21/Techniques/html/H93 https://www.w3.org/WAI/WCAG21/Techniques/failures/F77 https://www.ibm.com/able/requirements/requirements/#4_1_1 Is it necessary to put an ID on the rect tag? ### Expected Behavior All IDs should be unique. ### Environment ```markdown https://codesandbox.io/embed/polished-monad-v0vopl?fontsize=14&hidenavigation=1&theme=dark ``` ### Any additional comments? _No response_ -- This is an automated message from the Apache Git Service. To respond to the message, please log on to GitHub and use the URL above to go to the specific comment. To unsubscribe, e-mail: commits-unsubscr...@echarts.apache.org.apache.org For queries about this service, please contact Infrastructure at: us...@infra.apache.org - To unsubscribe, e-mail: commits-unsubscr...@echarts.apache.org For additional commands, e-mail: commits-h...@echarts.apache.org
[GitHub] [echarts] infacto opened a new issue, #18193: [Feature] New chart type.
infacto opened a new issue, #18193: URL: https://github.com/apache/echarts/issues/18193 ### What problem does this feature solve? 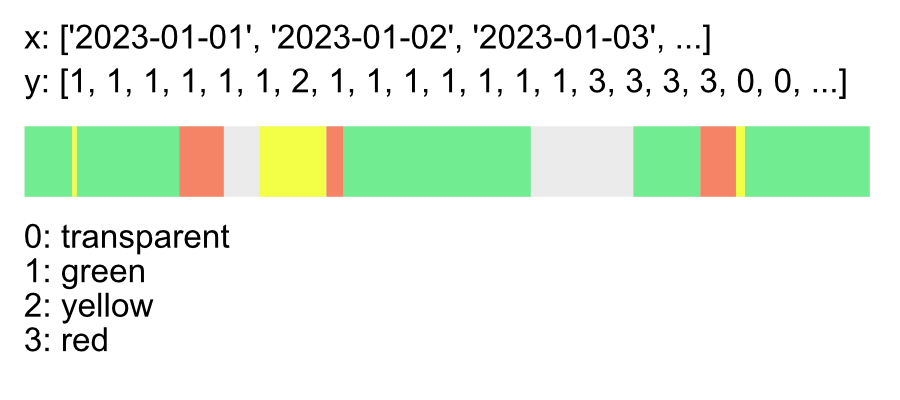 (pseudo) Tooltip: Custom text depending on value (1,2,3). ### What does the proposed API look like? I found a similar appearance like https://echarts.apache.org/examples/en/editor.html?c=custom-profile But it seems a bit different. Is this currently possible? Otherwise I would suggest this as a new chart type. Not sure how to name it. -- This is an automated message from the Apache Git Service. To respond to the message, please log on to GitHub and use the URL above to go to the specific comment. To unsubscribe, e-mail: commits-unsubscr...@echarts.apache.org.apache.org For queries about this service, please contact Infrastructure at: us...@infra.apache.org - To unsubscribe, e-mail: commits-unsubscr...@echarts.apache.org For additional commands, e-mail: commits-h...@echarts.apache.org
[GitHub] [echarts] echarts-bot[bot] commented on issue #18192: [Bug] 使用getDataURL方法获取svg文本时,当有<符号时,没进行转义破坏了xml文档结构
echarts-bot[bot] commented on issue #18192: URL: https://github.com/apache/echarts/issues/18192#issuecomment-1397046866 @minren118 It seems you are not using English, I've helped translate the content automatically. To make your issue understood by more people and get helped, we'd like to suggest using English next time. 🤗 TRANSLATED **TITLE** [Bug] When using the getDataURL method to get svg text, when there are < symbols, it is not escaped and destroys the xml document structure **BODY** ### Version 5.3 ### Link to Minimal Reproduction _No response_ ### Steps to Reproduce When using getDataURL to output the svg text of the chart, it is found that ECharts does not escape and re-output special symbols such as <, resulting in an error in the exported svg text. When the browser opens, it will show such a logo, and the actual content cannot be rendered.  The actual content is as follows: the XML document structure is broken by <.  When escaped, it is normal.<5 ### Current Behavior The exported string is not escaped. ### Expected Behavior If you need to include special characters in the exported string, escape it before output. ### Environment ```markdown - OS: - Browser: - Framework: ``` ### Any additional comments? _No response_ -- This is an automated message from the Apache Git Service. To respond to the message, please log on to GitHub and use the URL above to go to the specific comment. To unsubscribe, e-mail: commits-unsubscr...@echarts.apache.org For queries about this service, please contact Infrastructure at: us...@infra.apache.org - To unsubscribe, e-mail: commits-unsubscr...@echarts.apache.org For additional commands, e-mail: commits-h...@echarts.apache.org
[GitHub] [echarts] minren118 opened a new issue, #18192: [Bug] 使用getDataURL方法获取svg文本时,当有<符号时,没进行转义破坏了xml文档结构
minren118 opened a new issue, #18192: URL: https://github.com/apache/echarts/issues/18192 ### Version 5.3 ### Link to Minimal Reproduction _No response_ ### Steps to Reproduce 当使用getDataURL对图表进行svg文本输出时,发现ECharts没有对特殊的符号如<进行转义再输出,导致导出的svg文本出错。 浏览器打开会显示这样的标识,实际的内容没法渲染出来。  实际内容如下:因<破坏了xml文档结构。  当转义后,就正常了。 <5 ### Current Behavior 未对导出的字符串进行转义。 ### Expected Behavior 需要对导出的字符串包含特殊字符时,转义后再输出。 ### Environment ```markdown - OS: - Browser: - Framework: ``` ### Any additional comments? _No response_ -- This is an automated message from the Apache Git Service. To respond to the message, please log on to GitHub and use the URL above to go to the specific comment. To unsubscribe, e-mail: commits-unsubscr...@echarts.apache.org.apache.org For queries about this service, please contact Infrastructure at: us...@infra.apache.org - To unsubscribe, e-mail: commits-unsubscr...@echarts.apache.org For additional commands, e-mail: commits-h...@echarts.apache.org
[GitHub] [echarts] jatin-caizin commented on issue #12513: Show total data count next to legend labels
jatin-caizin commented on issue #12513:
URL: https://github.com/apache/echarts/issues/12513#issuecomment-1396884985

   Can we add custom data to bar and line chart legend irrespective of series
object?


--
This is an automated message from the Apache Git Service.
To respond to the message, please log on to GitHub and use the
URL above to go to the specific comment.

To unsubscribe, e-mail: commits-unsubscr...@echarts.apache.org

For queries about this service, please contact Infrastructure at:
us...@infra.apache.org


-
To unsubscribe, e-mail: commits-unsubscr...@echarts.apache.org
For additional commands, e-mail: commits-h...@echarts.apache.org
[GitHub] [echarts] spoojaj opened a new issue, #18191: [Feature] Need different color for each brush marker.
spoojaj opened a new issue, #18191:
URL: https://github.com/apache/echarts/issues/18191
### What problem does this feature solve?
Get different color for each brush area like given in the example below -

Right now we have option to set color for brush component but it is
applicable for all brush.
We need feature to provide diff colors for each area.
Below is the code that we have tried for achieving above functionality.
function func(x) {
x /= 10;
return Math.random() * 22
}
function generateData() {
let data = [];
for (let i = 0; i <= 10; i += 0.1) {
data.push([i, func(i)]);
}
return data;
}
let colors = ['red', 'green','yellow', 'blue'];
option = {
animation: false,
toolbox: {
feature: {
dataZoom: {
yAxisIndex: false
},
brush: {
type: ['lineX', 'clear', 'keep']
},
}
},
brush: {
xAxisIndex: 'all',
brushLink: 'all',
brushStyle: {
color: 'white',
},
outOfBrush: {
colorAlpha: 0.1
}
},
graphic: {
elements: [],
},
grid: {
top: 100,
left: 50,
right: 40,
bottom: 50
},
xAxis: {
minorTick: {
show: true
},
minorSplitLine: {
show: true
}
},
yAxis: {
minorTick: {
show: true
},
minorSplitLine: {
show: true
}
},
series: [
{
type: 'line',
showSymbol: false,
clip: true,
data: generateData()
}
]
};
let count = 0;
myChart.on('brushEnd', function() {
let newOption = option;
newOption.brush.brushStyle.color = colors[count],
count = count + 1;
myChart.setOption(newOption);
})
### What does the proposed API look like?
NaN
--
This is an automated message from the Apache Git Service.
To respond to the message, please log on to GitHub and use the
URL above to go to the specific comment.
To unsubscribe, e-mail: commits-unsubscr...@echarts.apache.org.apache.org
For queries about this service, please contact Infrastructure at:
us...@infra.apache.org
-
To unsubscribe, e-mail: commits-unsubscr...@echarts.apache.org
For additional commands, e-mail: commits-h...@echarts.apache.org
[GitHub] [echarts] echarts-bot[bot] closed issue #18190: [Feature]
echarts-bot[bot] closed issue #18190: [Feature]
URL: https://github.com/apache/echarts/issues/18190


--
This is an automated message from the Apache Git Service.
To respond to the message, please log on to GitHub and use the
URL above to go to the specific comment.

To unsubscribe, e-mail: commits-unsubscr...@echarts.apache.org

For queries about this service, please contact Infrastructure at:
us...@infra.apache.org


-
To unsubscribe, e-mail: commits-unsubscr...@echarts.apache.org
For additional commands, e-mail: commits-h...@echarts.apache.org
[GitHub] [echarts] ReactRitik opened a new issue, #18190: [Feature]
ReactRitik opened a new issue, #18190: URL: https://github.com/apache/echarts/issues/18190 ### What problem does this feature solve? how to create left and right branch in same tree ### What does the proposed API look like?  -- This is an automated message from the Apache Git Service. To respond to the message, please log on to GitHub and use the URL above to go to the specific comment. To unsubscribe, e-mail: commits-unsubscr...@echarts.apache.org.apache.org For queries about this service, please contact Infrastructure at: us...@infra.apache.org - To unsubscribe, e-mail: commits-unsubscr...@echarts.apache.org For additional commands, e-mail: commits-h...@echarts.apache.org
[GitHub] [echarts] fyzhu commented on issue #17763: [Bug] 使用Vue3渲染雷达图,控制台出现The ticks may be not readable
fyzhu commented on issue #17763:
URL: https://github.com/apache/echarts/issues/17763#issuecomment-1396665994

   1. radar don't have option of alignTicks,but align radar's tick in code
   2. haven't check alignTicks' value before alignScaleTicks


--
This is an automated message from the Apache Git Service.
To respond to the message, please log on to GitHub and use the
URL above to go to the specific comment.

To unsubscribe, e-mail: commits-unsubscr...@echarts.apache.org

For queries about this service, please contact Infrastructure at:
us...@infra.apache.org


-
To unsubscribe, e-mail: commits-unsubscr...@echarts.apache.org
For additional commands, e-mail: commits-h...@echarts.apache.org
[GitHub] [echarts] arundeep78 opened a new issue, #18189: Theme settings for graphic elements
arundeep78 opened a new issue, #18189:
URL: https://github.com/apache/echarts/issues/18189

   ### What problem does this feature solve?

   Add a possibility to configure theme settings for graphic elements e.g. text
or rectangle etc.

   We use graphic elements to [add our Logo and website
URL](https://arcticrisk.org/latest-data/global-risks/). Along with extra
information e.g. Data source, last updated etc.
   They are standardized across all plots. We always had dark theme and it
worked. We now implemented light theme as well, but we can change the text
color for these elements or borders etc. in the theme json. Other texts e.g.
title:text, title:subtext and so on works fine.

   At the moment, we would have to go with a trade-off as in[ the
example](https://echarts.apache.org/examples/en/editor.html?c=line-graphic).
But, this takes away the color scheme  from the plot.

   if this is not possible and an alternative method must be used or is better
than configuring themes, then your suggestion would be helpful.

   ### What does the proposed API look like?

   Frankly, I do not know how it can be implemented, but would like to
configure below settings in theme e.g. to switch  colors with theme switch.

   ```
   dark theme:
   {
   graphic: {
  text: {
  style: {
fill: "white"
  }
   }
 }
   }

   light theme:
   {
   graphic: {
  text: {
  style: {
fill: "black"
  }
   }
 }
   }
   ```


--
This is an automated message from the Apache Git Service.
To respond to the message, please log on to GitHub and use the
URL above to go to the specific comment.

To unsubscribe, e-mail: commits-unsubscr...@echarts.apache.org.apache.org

For queries about this service, please contact Infrastructure at:
us...@infra.apache.org


-
To unsubscribe, e-mail: commits-unsubscr...@echarts.apache.org
For additional commands, e-mail: commits-h...@echarts.apache.org
[GitHub] [echarts] OrcVole opened a new issue, #18188: [Feature] Apache eCharts Timeline
OrcVole opened a new issue, #18188: URL: https://github.com/apache/echarts/issues/18188 ### What problem does this feature solve? The "Lines" section does not have any tools to help indicate sequence of events in a chronology. Understanding the correct order of events is fundamental to creating a narrative to understand the world. Chronology helps us understand history and enables us to better plan the future. it is a key tool in several areas, such as forensics. We should have easy to use and beautiful to see timelines of various sorts for different use cases. ### What does the proposed API look like? There are several examples of timelines to use as examples here;       -- This is an automated message from the Apache Git Service. To respond to the message, please log on to GitHub and use the URL above to go to the specific comment. To unsubscribe, e-mail: commits-unsubscr...@echarts.apache.org.apache.org For queries about this service, please contact Infrastructure at: us...@infra.apache.org - To unsubscribe, e-mail: commits-unsubscr...@echarts.apache.org For additional commands, e-mail: commits-h...@echarts.apache.org
[GitHub] [echarts] frntline-dev commented on issue #12923: [Design] Provide the color scheme generators to produce color schemes for your chart.
frntline-dev commented on issue #12923:
URL: https://github.com/apache/echarts/issues/12923#issuecomment-1396101331

   Any update on this?


--
This is an automated message from the Apache Git Service.
To respond to the message, please log on to GitHub and use the
URL above to go to the specific comment.

To unsubscribe, e-mail: commits-unsubscr...@echarts.apache.org

For queries about this service, please contact Infrastructure at:
us...@infra.apache.org


-
To unsubscribe, e-mail: commits-unsubscr...@echarts.apache.org
For additional commands, e-mail: commits-h...@echarts.apache.org
[GitHub] [echarts] github-actions[bot] commented on issue #13827: Theme-Builder适配Echarts V5
github-actions[bot] commented on issue #13827:
URL: https://github.com/apache/echarts/issues/13827#issuecomment-1396085809

   This issue has been automatically marked as stale because it did not have
recent activity. It will be closed in 7 days if no further activity occurs. If
you wish not to mark it as stale, please leave a comment in this issue.


--
This is an automated message from the Apache Git Service.
To respond to the message, please log on to GitHub and use the
URL above to go to the specific comment.

To unsubscribe, e-mail: commits-unsubscr...@echarts.apache.org

For queries about this service, please contact Infrastructure at:
us...@infra.apache.org


-
To unsubscribe, e-mail: commits-unsubscr...@echarts.apache.org
For additional commands, e-mail: commits-h...@echarts.apache.org
[GitHub] [echarts] github-actions[bot] commented on issue #14060: echart地图坐标怎么转成页面offset坐标
github-actions[bot] commented on issue #14060:
URL: https://github.com/apache/echarts/issues/14060#issuecomment-1396086005

   This issue has been automatically marked as stale because it did not have
recent activity. It will be closed in 7 days if no further activity occurs. If
you wish not to mark it as stale, please leave a comment in this issue.


--
This is an automated message from the Apache Git Service.
To respond to the message, please log on to GitHub and use the
URL above to go to the specific comment.

To unsubscribe, e-mail: commits-unsubscr...@echarts.apache.org

For queries about this service, please contact Infrastructure at:
us...@infra.apache.org


-
To unsubscribe, e-mail: commits-unsubscr...@echarts.apache.org
For additional commands, e-mail: commits-h...@echarts.apache.org
[GitHub] [echarts] github-actions[bot] closed issue #13993: echarts-gl 移动端无法响应click事件
github-actions[bot] closed issue #13993: echarts-gl 移动端无法响应click事件
URL: https://github.com/apache/echarts/issues/13993


--
This is an automated message from the Apache Git Service.
To respond to the message, please log on to GitHub and use the
URL above to go to the specific comment.

To unsubscribe, e-mail: commits-unsubscr...@echarts.apache.org

For queries about this service, please contact Infrastructure at:
us...@infra.apache.org


-
To unsubscribe, e-mail: commits-unsubscr...@echarts.apache.org
For additional commands, e-mail: commits-h...@echarts.apache.org
[GitHub] [echarts] github-actions[bot] commented on issue #14045: 桑基图width超过20000后图形无法绘制
github-actions[bot] commented on issue #14045:
URL: https://github.com/apache/echarts/issues/14045#issuecomment-1396085944

   This issue has been automatically marked as stale because it did not have
recent activity. It will be closed in 7 days if no further activity occurs. If
you wish not to mark it as stale, please leave a comment in this issue.


--
This is an automated message from the Apache Git Service.
To respond to the message, please log on to GitHub and use the
URL above to go to the specific comment.

To unsubscribe, e-mail: commits-unsubscr...@echarts.apache.org

For queries about this service, please contact Infrastructure at:
us...@infra.apache.org


-
To unsubscribe, e-mail: commits-unsubscr...@echarts.apache.org
For additional commands, e-mail: commits-h...@echarts.apache.org
[GitHub] [echarts] github-actions[bot] commented on issue #11997: Support for monthly time axis labels
github-actions[bot] commented on issue #11997:
URL: https://github.com/apache/echarts/issues/11997#issuecomment-1396085722

   This issue has been automatically closed because it did not have recent
activity. If this remains to be a problem with the latest version of Apache
ECharts, please open a new issue and link this to it. Thanks!


--
This is an automated message from the Apache Git Service.
To respond to the message, please log on to GitHub and use the
URL above to go to the specific comment.

To unsubscribe, e-mail: commits-unsubscr...@echarts.apache.org

For queries about this service, please contact Infrastructure at:
us...@infra.apache.org


-
To unsubscribe, e-mail: commits-unsubscr...@echarts.apache.org
For additional commands, e-mail: commits-h...@echarts.apache.org
[GitHub] [echarts] github-actions[bot] commented on issue #13993: echarts-gl 移动端无法响应click事件
github-actions[bot] commented on issue #13993:
URL: https://github.com/apache/echarts/issues/13993#issuecomment-1396085872

   This issue has been automatically closed because it did not have recent
activity. If this remains to be a problem with the latest version of Apache
ECharts, please open a new issue and link this to it. Thanks!


--
This is an automated message from the Apache Git Service.
To respond to the message, please log on to GitHub and use the
URL above to go to the specific comment.

To unsubscribe, e-mail: commits-unsubscr...@echarts.apache.org

For queries about this service, please contact Infrastructure at:
us...@infra.apache.org


-
To unsubscribe, e-mail: commits-unsubscr...@echarts.apache.org
For additional commands, e-mail: commits-h...@echarts.apache.org
[GitHub] [echarts] github-actions[bot] closed issue #11997: Support for monthly time axis labels
github-actions[bot] closed issue #11997: Support for monthly time axis labels
URL: https://github.com/apache/echarts/issues/11997


--
This is an automated message from the Apache Git Service.
To respond to the message, please log on to GitHub and use the
URL above to go to the specific comment.

To unsubscribe, e-mail: commits-unsubscr...@echarts.apache.org

For queries about this service, please contact Infrastructure at:
us...@infra.apache.org


-
To unsubscribe, e-mail: commits-unsubscr...@echarts.apache.org
For additional commands, e-mail: commits-h...@echarts.apache.org
[GitHub] [echarts] nico-robert commented on issue #18185: [Bug] borderColor hides bar color with large data
nico-robert commented on issue #18185:
URL: https://github.com/apache/echarts/issues/18185#issuecomment-1387421042

   okay @Ovilia, It was just to show the difference between 2 versions of
Echarts. For me (personal opinion) the result in version 5.2.1 is correct ,
because the borderColor does not interact with bar color with large data (I'm
surprised). But I am agree with you for general series. Not a bug probably ,
but the visualization was more fun with this version. That said thank you for
your quick response.


--
This is an automated message from the Apache Git Service.
To respond to the message, please log on to GitHub and use the
URL above to go to the specific comment.

To unsubscribe, e-mail: commits-unsubscr...@echarts.apache.org

For queries about this service, please contact Infrastructure at:
us...@infra.apache.org


-
To unsubscribe, e-mail: commits-unsubscr...@echarts.apache.org
For additional commands, e-mail: commits-h...@echarts.apache.org
[GitHub] [echarts] gzhong88 commented on issue #18175: [Bug] Heatmap does not show chart after a large no-data gap
gzhong88 commented on issue #18175: URL: https://github.com/apache/echarts/issues/18175#issuecomment-1387314707 Above Heatmpa_issue.pptx contains a recorded video which shows how the issue can be reproduced. Just click at Heatmpa_issue.pptx link to download and open it, then click at the play button at the bottom to see the video. 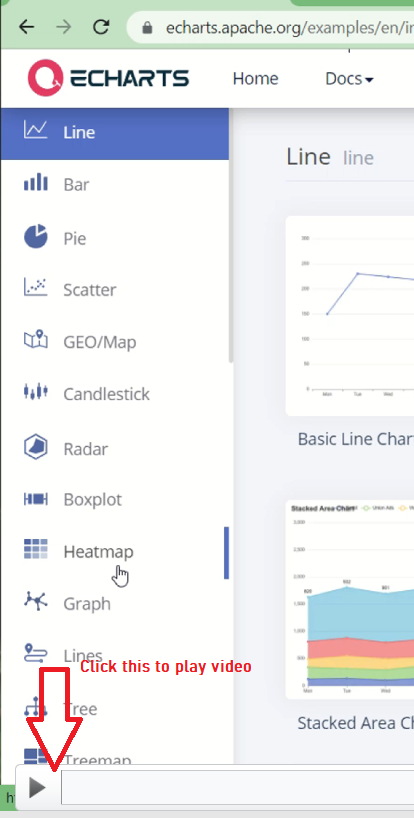 Explanation of the video: In the beginning part of the video, after I copied & pasted the code and clicked the Run button. I intentionally moved my mouse to trigger the drawing of the remaining chart. In the late part of the video, after I copied & pasted the code and clicked the Run button. I hand off my mouse to prevent trigger mouse event(點擊Run按鈕后,手馬上離開鼠標,以防移動鼠標trigger Event). You can see the rest part of chart was not drawn. -- This is an automated message from the Apache Git Service. To respond to the message, please log on to GitHub and use the URL above to go to the specific comment. To unsubscribe, e-mail: commits-unsubscr...@echarts.apache.org For queries about this service, please contact Infrastructure at: us...@infra.apache.org - To unsubscribe, e-mail: commits-unsubscr...@echarts.apache.org For additional commands, e-mail: commits-h...@echarts.apache.org
[GitHub] [echarts] gzhong88 commented on issue #18175: [Bug] Heatmap does not show chart after a large no-data gap
gzhong88 commented on issue #18175:
URL: https://github.com/apache/echarts/issues/18175#issuecomment-1387277986


[Heatmap_issue.pptx](https://github.com/apache/echarts/files/10448131/Heatmap_issue.pptx)


--
This is an automated message from the Apache Git Service.
To respond to the message, please log on to GitHub and use the
URL above to go to the specific comment.

To unsubscribe, e-mail: commits-unsubscr...@echarts.apache.org

For queries about this service, please contact Infrastructure at:
us...@infra.apache.org


-
To unsubscribe, e-mail: commits-unsubscr...@echarts.apache.org
For additional commands, e-mail: commits-h...@echarts.apache.org
[GitHub] [echarts] ousmorez commented on issue #18147: [Bug] Resize function, do not work while using window.print
ousmorez commented on issue #18147:
URL: https://github.com/apache/echarts/issues/18147#issuecomment-1387042675
@Ovilia I tried to resize the chart before starting the print process using
the following code:
```javascript
var mediaQueryList = window.matchMedia('print');
mediaQueryList.addListener(function(mql) {
if (mql.matches) {
myChart.resize();
}
else {
myChart.resize();
}
});
```
But I noticed that the resizing process starts immediately after opening the
print dialog. After print dialog pops up the chart will resize, but print
process will print the chart that is not resized yet.

--
This is an automated message from the Apache Git Service.
To respond to the message, please log on to GitHub and use the
URL above to go to the specific comment.
To unsubscribe, e-mail: commits-unsubscr...@echarts.apache.org
For queries about this service, please contact Infrastructure at:
us...@infra.apache.org
-
To unsubscribe, e-mail: commits-unsubscr...@echarts.apache.org
For additional commands, e-mail: commits-h...@echarts.apache.org
[GitHub] [echarts] Ovilia commented on issue #18183: [Feature] Grading template for xAxis.axisLabel.formatter by quarter
Ovilia commented on issue #18183:
URL: https://github.com/apache/echarts/issues/18183#issuecomment-1386741388

   Please add more information. I'm not sure what you mean.


--
This is an automated message from the Apache Git Service.
To respond to the message, please log on to GitHub and use the
URL above to go to the specific comment.

To unsubscribe, e-mail: commits-unsubscr...@echarts.apache.org

For queries about this service, please contact Infrastructure at:
us...@infra.apache.org


-
To unsubscribe, e-mail: commits-unsubscr...@echarts.apache.org
For additional commands, e-mail: commits-h...@echarts.apache.org
[GitHub] [echarts] Ovilia commented on issue #18185: [Bug] borderColor hides bar color with large data
Ovilia commented on issue #18185:
URL: https://github.com/apache/echarts/issues/18185#issuecomment-1386681173

   The current behavior seems to be reasonable. As for the candlestick series,
we are considering provide a way to dynamically change the range of data one
bar represents so that there won't be too many bars like the example. But for
general series, I think the current behavior is as expected.


--
This is an automated message from the Apache Git Service.
To respond to the message, please log on to GitHub and use the
URL above to go to the specific comment.

To unsubscribe, e-mail: commits-unsubscr...@echarts.apache.org

For queries about this service, please contact Infrastructure at:
us...@infra.apache.org


-
To unsubscribe, e-mail: commits-unsubscr...@echarts.apache.org
For additional commands, e-mail: commits-h...@echarts.apache.org
[GitHub] [echarts] echarts-bot[bot] commented on issue #18187: [Bug] Graph force emphasis adjacency, symbol disappear after hover when data is too large
echarts-bot[bot] commented on issue #18187:
URL: https://github.com/apache/echarts/issues/18187#issuecomment-1386678649

   @windinging Please provide a demo for the issue either with [Official
Editor](https://echarts.apache.org/examples/editor.html),
[CodePen](https://codepen.io/Ovilia/pen/dyYWXWM),
[CodeSandbox](https://codesandbox.io/s/echarts-basic-example-template-mpfz1s)
or [JSFiddle](https://jsfiddle.net/plainheart/e46ozpqj/7/).


--
This is an automated message from the Apache Git Service.
To respond to the message, please log on to GitHub and use the
URL above to go to the specific comment.

To unsubscribe, e-mail: commits-unsubscr...@echarts.apache.org

For queries about this service, please contact Infrastructure at:
us...@infra.apache.org


-
To unsubscribe, e-mail: commits-unsubscr...@echarts.apache.org
For additional commands, e-mail: commits-h...@echarts.apache.org
[GitHub] [echarts] Ovilia commented on issue #18181: [Bug] 折线图中当数据全部为100、200、300、以此类推,折线图显示存在问题
Ovilia commented on issue #18181:
URL: https://github.com/apache/echarts/issues/18181#issuecomment-1386677448

   如 @zhonghuaifang 所说,如果有这类定制 max 的需求,需要自己通过 max 指定,可以通过数据动态计算后设置


--
This is an automated message from the Apache Git Service.
To respond to the message, please log on to GitHub and use the
URL above to go to the specific comment.

To unsubscribe, e-mail: commits-unsubscr...@echarts.apache.org

For queries about this service, please contact Infrastructure at:
us...@infra.apache.org


-
To unsubscribe, e-mail: commits-unsubscr...@echarts.apache.org
For additional commands, e-mail: commits-h...@echarts.apache.org
[GitHub] [echarts] Malachite40 commented on issue #16693: [Bug] Text Outline not changeable
Malachite40 commented on issue #16693:
URL: https://github.com/apache/echarts/issues/16693#issuecomment-1386599150

   I'm also having this issue still


--
This is an automated message from the Apache Git Service.
To respond to the message, please log on to GitHub and use the
URL above to go to the specific comment.

To unsubscribe, e-mail: commits-unsubscr...@echarts.apache.org

For queries about this service, please contact Infrastructure at:
us...@infra.apache.org


-
To unsubscribe, e-mail: commits-unsubscr...@echarts.apache.org
For additional commands, e-mail: commits-h...@echarts.apache.org
[GitHub] [echarts] windinging commented on issue #18187: [Bug] Graph force emphasis adjacency, symbol disappear after hover when data is too large
windinging commented on issue #18187: URL: https://github.com/apache/echarts/issues/18187#issuecomment-1386412152 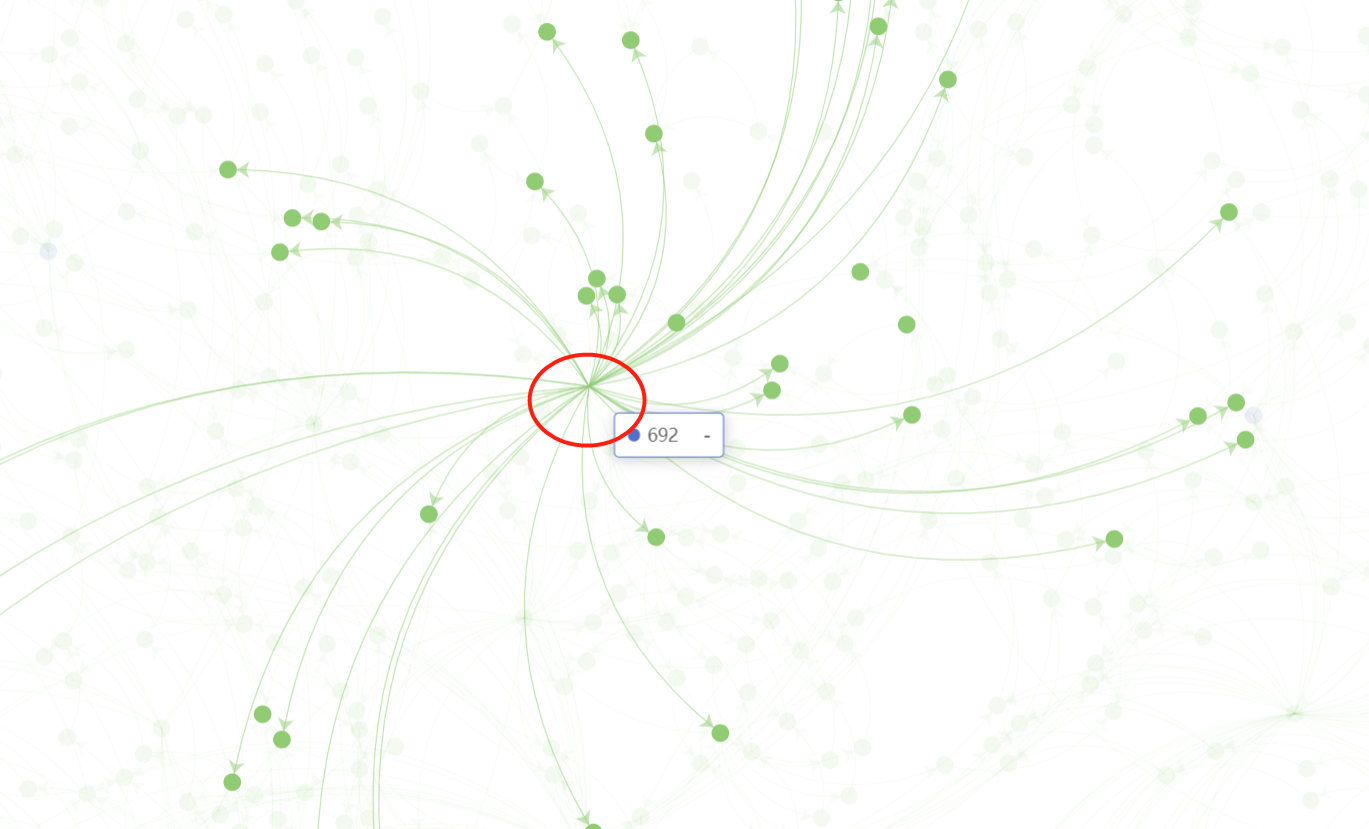 -- This is an automated message from the Apache Git Service. To respond to the message, please log on to GitHub and use the URL above to go to the specific comment. To unsubscribe, e-mail: commits-unsubscr...@echarts.apache.org For queries about this service, please contact Infrastructure at: us...@infra.apache.org - To unsubscribe, e-mail: commits-unsubscr...@echarts.apache.org For additional commands, e-mail: commits-h...@echarts.apache.org
[GitHub] [echarts] windinging opened a new issue, #18187: [Bug] Graph force emphasis adjacency, symbol disappear after hover when data is too large
windinging opened a new issue, #18187:
URL: https://github.com/apache/echarts/issues/18187

   ### Version

   5.4.1

   ### Link to Minimal Reproduction

   _No response_

   ### Steps to Reproduce

   ```
   {
 type: 'graph',
 layout: 'force',
 emphasis: {
   focus: 'adjacency',
 }
   }
   ```

   ### Current Behavior

   type:'graph', layout:'force',emphasis:'adjaceny'.
   When data is too large, hover symbol, sometimes the symbol will disappear
after hover,it seems the opacty is 0, when hover the disappeared symbol the
label show noramlly.

   ### Expected Behavior

   type:'graph', layout:'force',emphasis:'adjaceny'.
   After hover symbol, symbol behave normally, not disappear.

   ### Environment

   ```markdown
   - OS:
   - Browser:
   - Framework:
   ```


   ### Any additional comments?

   _No response_


--
This is an automated message from the Apache Git Service.
To respond to the message, please log on to GitHub and use the
URL above to go to the specific comment.

To unsubscribe, e-mail: commits-unsubscr...@echarts.apache.org.apache.org

For queries about this service, please contact Infrastructure at:
us...@infra.apache.org


-
To unsubscribe, e-mail: commits-unsubscr...@echarts.apache.org
For additional commands, e-mail: commits-h...@echarts.apache.org
[GitHub] [echarts] echarts-bot[bot] closed issue #18186: [Bug]
echarts-bot[bot] closed issue #18186: [Bug]
URL: https://github.com/apache/echarts/issues/18186


--
This is an automated message from the Apache Git Service.
To respond to the message, please log on to GitHub and use the
URL above to go to the specific comment.

To unsubscribe, e-mail: commits-unsubscr...@echarts.apache.org

For queries about this service, please contact Infrastructure at:
us...@infra.apache.org


-
To unsubscribe, e-mail: commits-unsubscr...@echarts.apache.org
For additional commands, e-mail: commits-h...@echarts.apache.org
[GitHub] [echarts] windinging opened a new issue, #18186: [Bug]
windinging opened a new issue, #18186:
URL: https://github.com/apache/echarts/issues/18186

   ### Version

   5.4.1

   ### Link to Minimal Reproduction

   _No response_

   ### Steps to Reproduce

   ```
   {
 type: 'graph',
 layout: 'force',
 emphasis: {
   focus: 'adjacency',
 }
   }
   ```

   ### Current Behavior

   type:'graph', layout:'force',emphasis:'adjaceny'.
   When data is too large, hover symbol, sometimes the symbol will disappear
after hover,it seems the opacty is 0, when hover the disappeared symbol the
label show noramlly.

   ### Expected Behavior

   type:'graph', layout:'force',emphasis:'adjaceny'.
   After hover symbol, symbol behave normally, not disappear.

   ### Environment

   ```markdown
   - OS:
   - Browser:
   - Framework:
   ```


   ### Any additional comments?

   _No response_


--
This is an automated message from the Apache Git Service.
To respond to the message, please log on to GitHub and use the
URL above to go to the specific comment.

To unsubscribe, e-mail: commits-unsubscr...@echarts.apache.org.apache.org

For queries about this service, please contact Infrastructure at:
us...@infra.apache.org


-
To unsubscribe, e-mail: commits-unsubscr...@echarts.apache.org
For additional commands, e-mail: commits-h...@echarts.apache.org
[GitHub] [echarts] echarts-bot[bot] closed issue #18178: [Feature] markpoint data zlevel or z
echarts-bot[bot] closed issue #18178: [Feature] markpoint data zlevel or z
URL: https://github.com/apache/echarts/issues/18178


--
This is an automated message from the Apache Git Service.
To respond to the message, please log on to GitHub and use the
URL above to go to the specific comment.

To unsubscribe, e-mail: commits-unsubscr...@echarts.apache.org

For queries about this service, please contact Infrastructure at:
us...@infra.apache.org


-
To unsubscribe, e-mail: commits-unsubscr...@echarts.apache.org
For additional commands, e-mail: commits-h...@echarts.apache.org
[GitHub] [echarts] Ovilia commented on issue #18178: [Feature] markpoint data zlevel or z
Ovilia commented on issue #18178:
URL: https://github.com/apache/echarts/issues/18178#issuecomment-1386384152

   Please follow #15494


--
This is an automated message from the Apache Git Service.
To respond to the message, please log on to GitHub and use the
URL above to go to the specific comment.

To unsubscribe, e-mail: commits-unsubscr...@echarts.apache.org

For queries about this service, please contact Infrastructure at:
us...@infra.apache.org


-
To unsubscribe, e-mail: commits-unsubscr...@echarts.apache.org
For additional commands, e-mail: commits-h...@echarts.apache.org
[GitHub] [echarts] Ovilia closed issue #18178: [Feature] markpoint data zlevel or z
Ovilia closed issue #18178: [Feature] markpoint data zlevel or z
URL: https://github.com/apache/echarts/issues/18178


--
This is an automated message from the Apache Git Service.
To respond to the message, please log on to GitHub and use the
URL above to go to the specific comment.

To unsubscribe, e-mail: commits-unsubscr...@echarts.apache.org

For queries about this service, please contact Infrastructure at:
us...@infra.apache.org


-
To unsubscribe, e-mail: commits-unsubscr...@echarts.apache.org
For additional commands, e-mail: commits-h...@echarts.apache.org
[GitHub] [echarts] Ovilia commented on issue #18175: [Bug] Heatmap does not show chart after a large no-data gap
Ovilia commented on issue #18175:
URL: https://github.com/apache/echarts/issues/18175#issuecomment-1386383202

   Cannot reproduce even with mouse hoving Run button.


--
This is an automated message from the Apache Git Service.
To respond to the message, please log on to GitHub and use the
URL above to go to the specific comment.

To unsubscribe, e-mail: commits-unsubscr...@echarts.apache.org

For queries about this service, please contact Infrastructure at:
us...@infra.apache.org


-
To unsubscribe, e-mail: commits-unsubscr...@echarts.apache.org
For additional commands, e-mail: commits-h...@echarts.apache.org
[GitHub] [echarts] linwrui commented on issue #18177: [Bug] Line graph animation waiting so long cause animationDuration is also working on blank data
linwrui commented on issue #18177:
URL: https://github.com/apache/echarts/issues/18177#issuecomment-1386341993

   > Where is the _blank data_? Shouldn't it be `data: [null, null, null, null,
null, ..., 218, 135, 147, 260].map((o, index) => [index, o])` But even then it
all depends on **animationDuration**. With `animationDuration: 200` drawing is
almost instant. I think it works as documented.

   Set animationDuration with a smaller value is really not perceptive, but the
line graph will draw too fast!


--
This is an automated message from the Apache Git Service.
To respond to the message, please log on to GitHub and use the
URL above to go to the specific comment.

To unsubscribe, e-mail: commits-unsubscr...@echarts.apache.org

For queries about this service, please contact Infrastructure at:
us...@infra.apache.org


-
To unsubscribe, e-mail: commits-unsubscr...@echarts.apache.org
For additional commands, e-mail: commits-h...@echarts.apache.org
[GitHub] [echarts] linwrui commented on issue #18177: [Bug] Line graph animation waiting so long cause animationDuration is also working on blank data
linwrui commented on issue #18177:
URL: https://github.com/apache/echarts/issues/18177#issuecomment-1386340528

   > Where is the _blank data_? Shouldn't it be `data: [null, null, null, null,
null, ..., 218, 135, 147, 260].map((o, index) => [index, o])` But even then it
all depends on **animationDuration**. With `animationDuration: 200` drawing is
almost instant. I think it works as documented.

   The xAxis is value axis. Shouldn't the animation start at the first data
point?


--
This is an automated message from the Apache Git Service.
To respond to the message, please log on to GitHub and use the
URL above to go to the specific comment.

To unsubscribe, e-mail: commits-unsubscr...@echarts.apache.org

For queries about this service, please contact Infrastructure at:
us...@infra.apache.org


-
To unsubscribe, e-mail: commits-unsubscr...@echarts.apache.org
For additional commands, e-mail: commits-h...@echarts.apache.org
[GitHub] [echarts] github-actions[bot] commented on issue #14047: Can I do a Bar Pattern
github-actions[bot] commented on issue #14047:
URL: https://github.com/apache/echarts/issues/14047#issuecomment-1386048670

   This issue has been automatically marked as stale because it did not have
recent activity. It will be closed in 7 days if no further activity occurs. If
you wish not to mark it as stale, please leave a comment in this issue.


--
This is an automated message from the Apache Git Service.
To respond to the message, please log on to GitHub and use the
URL above to go to the specific comment.

To unsubscribe, e-mail: commits-unsubscr...@echarts.apache.org

For queries about this service, please contact Infrastructure at:
us...@infra.apache.org


-
To unsubscribe, e-mail: commits-unsubscr...@echarts.apache.org
For additional commands, e-mail: commits-h...@echarts.apache.org
[GitHub] [echarts] github-actions[bot] commented on issue #14052: 请问柱状图使用渐变色方式,如何在IE8下兼容
github-actions[bot] commented on issue #14052:
URL: https://github.com/apache/echarts/issues/14052#issuecomment-1386048699

   This issue has been automatically marked as stale because it did not have
recent activity. It will be closed in 7 days if no further activity occurs. If
you wish not to mark it as stale, please leave a comment in this issue.


--
This is an automated message from the Apache Git Service.
To respond to the message, please log on to GitHub and use the
URL above to go to the specific comment.

To unsubscribe, e-mail: commits-unsubscr...@echarts.apache.org

For queries about this service, please contact Infrastructure at:
us...@infra.apache.org


-
To unsubscribe, e-mail: commits-unsubscr...@echarts.apache.org
For additional commands, e-mail: commits-h...@echarts.apache.org
[GitHub] [echarts] nico-robert opened a new issue, #18185: [Bug] borderColor hides bar color with large data
nico-robert opened a new issue, #18185:
URL: https://github.com/apache/echarts/issues/18185

   ### Version

   5.4.1

   ### Link to Minimal Reproduction

   _No response_

   ### Steps to Reproduce

   I don't know if in version 5.2.1 It was the good result , but when I add
`borderColor` property in ìtemStyle` (series), the color is not visible with
large data, in 5.4.1 yes. So it hides the color of the bars.
   ```
   {
 name: 'Volumn',
 type: 'bar',
 xAxisIndex: 1,
 yAxisIndex: 1,
 itemStyle: {
   color: '#7fbe9e',
   // Add black color...
   borderColor: 'black'
 },
 large: true,
 encode: {
   x: 0,
   y: 5
 }
   }
   ```

   ### Current Behavior

   In
[5.4.1](https://echarts.apache.org/examples/en/editor.html?c=candlestick-large&code=MYewdgzgLgBArgBwMIgDYgE4wLwwOQDEApsAAzml4DcAUKJLIgEKYAmRGK6WuhAHAEEKlWvWgxWIAO5gumHPgLlWAQwDMwanXDjJMlhnac083ktJ8AYgCY-WsbFVQVKOGFi5rRAKyidjlWcFAHMiMA5AogB5AAkAGSQACicXEDcoAEpaEAQoAEtwBQBvGhgJQJUIIigALhgSsrKINIxgIjqU0pgAXwAaLvyoVHb6rrKoIgAPWvwAEQqYAQBbNPc6vBgAahgSAAsVDCgIADoAM0wlwOOVVlYUJcuIZIrXdwyuvoGQNHyEOobGlAMHlgqEMOsVJM8hA8P1GjBIdCAAogPLuDj_MaAgCeCBGeFQaKIeCx3Q-cJgUG-qAARiBJpj4aciIE4BgRgD4SkAFrfJaM-GNbECKEQACSYHYDJgpxUqCqWLKZPhyp6FOCwNYdQA2ljOY1hqcZngAIykACksMVMGBwV2xrNlop8LpUCp_Jg1nIpOdo0FMENDotVv9tvt60dIcFuyIIPDMD4pF9ZVd7rqidJXQAuhTJiLoTq9daoLj8cBIsFMNioy7VqoMNiAOIqP4yuVVZMwAD0XZgaIAbhwqnUgXAiJ3ERA4kT_jBwNyOCA6rL5UQ1daIAhCVBp-FZxBdtJl-2159_Us0esUgBZNE1xqXaV4G-Qkkq3368al9bliaVhv3mUGp5KwEpSnUJqdnSbj1k2LbHquE6iruHJzmAC4YEubaruu_qTgAKnkwAANb7oeUgIVUuGCpu24oWRR7YVRZ6CpOcQqDSRCoAxFFMaenYXmAV4VLeYCATAj7Cc416vpmZQ5l0wqioW8KfjAEDlsMI4YGOna0XkUACOyKgCv6B6MaORDWqqSofhumkjJZnbAaBkpTBBelbgZABycBLJx4Ke

kh0LsZx3H1Op5GUfx1psTOEXmbxK7McFECESRPHRdR8L6Tu8VFJFjHJaeckwApZQ8nyKmNGpJZ4usaIQCBxKdnmopge5MDakmMAmuVNHOIcEFJtaYRar13rvkWZlRZSOnjtabXQh10rdb0vX9fCdX4hAhJGOJqYgB6Zp6YNMwnaNkrDaQpX9f20JwHKMmtvqiXRb6VTAkQ4pudKkFYqweRLGETXgHUABsvoIHkJDfdVqnWmU_ZymOHmIzAoDcHUiByBg1mdmpSMoyMAC0_3-mUmOYB00iyCYeP-jZZXkl0n0wxA8N-oK20_iokrDNARHEeJBlEEsADKJZaVz_pU4FOP052lP06QNMyLjSswHShgcLj2MIAYRga-j2tGyratgIbuv0_jl2gOwpmCtKI0UzA2I6pBMAACzrWo63WFm1k-tNgpgCowPrAAamgfliZ2PP4DSBziUtP3gb1nZKctv1o_6osS1LHLo3L6wEAA7KcnEAJwtSbbDW1jieoCoJHiSx8LNxgoTabpdsgA7MtO3ULsU-7MDeEHKrZjQ3S0KcbjAPkhShOEGCRLECSJKA6QZFzwwBEEuDalmtBlPvMCTJHxMKJs4RSDA8wTIkXomp7PUmlkXTn4JcATAo4OkBgAAKgmuQU-AZqha0qEQK-qAxwKBklAXYxw16SiOokXeICTRejAV_SBdJL7tgUHfRYGA17YkSF7T-Z9IGqGxAAJT5qEBQ2DwHnCwIkc-eQFCkCoH2GAAAeDGqwoB8LyJsTYu99RJyqLA-BuAZEwOvtsRByDUGSCWBg4BnpAEkwmuAso7CYCcMgQAKx4Xw8xQivaWIkVI60BDYEQG1KYrMChEiqJQXzDRWi9GkGON4TB5QGFMLXNsRRciiAGJ6FiRx7ZjjNEOBg6J58chhDFKwSYCDAhqLrB4nJXi0GaKCWoahBpIHAHQFUDJWTcCeMwjBfJSDCk-KCdYMpZQ8inGMZUkA1TMk4GwLgNJYAan2

NllUogNSJHRKZuffsMclhgAUHE-U2o1BuJAYkM05AtgwHqd49BQTvDkA6d2Xs2o8AjNhPgXpVQbkEmkN9KADzdhxmeQ8hZcCll4EDvCHsXVPY-xgH7T0fzGgpG1HkNxR9RrAH2IcE47DLhQDOBcQIhFgaJDwNiXF2ISbXmvCTW4AAdMAuxdg1AeDUCAMJ1qJEIXAsJuAf4TAyBkTsmxVnOJGTUrMxwqSWDyJMIgrBn4cutFy-kTj1n8sFcK0V4rOXcu6nKkAQqRVivacq6V7ZtR3KmZktVGrFXaslV82OAr1UKrFaQCV_pQhQHFiCMAzxnDrTyOtKVjKeV4lGUar1KqDV8vWlQ856kXVYhPh8Lo7IoBsmWSkNhC8l7LMdc64IrqUjrRSCtdaIzYHrQNYWjGkzZhAzGYPZGWAmqZuiV04xBa5QwAAHylr6Uo1A4yaIuoUGTWZOwcINsSE21Agj22yLlN2nKvbcAmgHVxKiala3LOwOjXNv1W0wBuq7MoAB-cNYpukGsGcMv1RajoIAOGuKQBldgTrXCAbpzdxDslAIYdGXIKjag3VKGAei-r6rLRWo1gjcDFrlJ-xoB6TRQbKHUMmUG6gAu8iAG0JA2Bzm6Qgdk900gQHWlUWAVItZrgQH0gyeRBxwd6rMrEcaE0RrrTG7oQA
   )

   ### Expected Behavior

   The good result for me in
[5.2.1](https://echarts.apache.org/examples/en/editor.html?c=candlestick-large&version=5.2.1&code=MYewdgzgLgBArgBwMIgDYgE4wLwwOQDEApsAAzml4DcAUKJLIgEKYAmRGK6WuhAHAEEKlWvWgxWIAO5gumHPgLlWAQwDMwanXDjJMlhnac083ktJ8AYgCY-WsbFVQVKOGFi5rRAKyidjlWcFAHMiMA5AogB5AAkAGSQACicXEDcoAEpaEAQoAEtwBQBvGhgJQJUIIigALhgSsrKINIxgIjqU0pgAXwAaLvyoVHb6rrKoIgAPWvwAEQqYAQBbNPc6vBgAahgSAAsVDCgIADoAM0wlwOOVVlYUJcuIZIrXdwyuvoGQNHyEOobGlAMHlgqEMOsVJM8hA8P1GjBIdCAAogPLuDj_MaAgCeCBGeFQaKIeCx3Q-cJgUG-qAARiBJpj4aciIE4BgRgD4SkAFrfJaM-GNbECKEQACSYHYDJgpxUqCqWLKZPhyp6FOCwNYdQA2ljOY1hqcZngAIykACksMVMGBwV2xrNlop8LpUCp_Jg1nIpOdo0FMENDotVv9tvt60dIcFuyIIPDMD4pF9ZVd7rqidJXQAuhTJiLoTq9daoLj8cBIsFMNioy7VqoMNiAOIqP4yuVVZMwAD0XZgaIAbhwqnUgXAiJ3ERA4kT_jBwNyOCA6rL5UQ1daIAhCVBp-FZxBdtJl-2159_Us0esUgBZNE1xqXaV4G-Qkkq3368al9bliaVhv3mUGp5KwEpSnUJqdnSbj1k2LbHquE6iruHJzmAC4YEubaruu_qTgAKnkwAANb7oeUgIVUuGCpu24oWRR7YVRZ6CpOcQqDSRCoAxFFMaenYXmAV4VLeYCATAj7Cc416vpmZQ5l0wqioW8KfjAEDlsMI4YGOna0XkUACOyKgCv6B6MaORDWq

qSofhumkjJZnbAaBkpTBBelbgZABycBLJx4Kekh0LsZx3H1Op5GUfx1psTOEXmbxK7McFECESRPHRdR8L6Tu8VFJFjHJaeckwApZQ8nyKmNGpJZ4usaIQCBxKdnmopge5MDakmMAmuVNHOIcEFJtaYRar13rvkWZlRZSOnjtabXQh10rdb0vX9fCdX4hAhJGOJqYgB6Zp6YNMwnaNkrDaQpX9f20JwHKMmtvqiXRb6VTAkQ4pudKkFYqweRLGETXgHUABsvoIHkJDfdVqnWmU_ZymOHmIzAoDcHUiByBg1mdmpSMoyMAC0_3-mUmOYB00iyCYeP-jZZXkl0n0wxA8N-oK20_iokrDNARHEeJBlEEsADKJZaVz_pU4FOP052lP06QNMyLjSswHShgcLj2MIAYRga-j2tGyratgIbuv0_jl2gOwpmCtKI0UzA2I6pBMAACzrWo63WFm1k-tNgpgCowPrAAam
[GitHub] [echarts] iamsee closed issue #18184: [Bug] A special line will appear when bar and pictorialBar are used together
iamsee closed issue #18184: [Bug] A special line will appear when bar and
pictorialBar are used together
URL: https://github.com/apache/echarts/issues/18184


--
This is an automated message from the Apache Git Service.
To respond to the message, please log on to GitHub and use the
URL above to go to the specific comment.

To unsubscribe, e-mail: commits-unsubscr...@echarts.apache.org

For queries about this service, please contact Infrastructure at:
us...@infra.apache.org


-
To unsubscribe, e-mail: commits-unsubscr...@echarts.apache.org
For additional commands, e-mail: commits-h...@echarts.apache.org
[GitHub] [echarts] echarts-bot[bot] commented on issue #18184: [Bug] A special line will appear when bar and pictorialBar are used together
echarts-bot[bot] commented on issue #18184: URL: https://github.com/apache/echarts/issues/18184#issuecomment-1385700859 @iamsee It seems you are not using English, I've helped translate the content automatically. To make your issue understood by more people and get helped, we'd like to suggest using English next time. 🤗 TRANSLATED **BODY** ### Version 5.4.1 ### Link to Minimal Reproduction _No response_ ### Steps to Reproduce [复现地址](https://echarts.apache.org/examples/zh/editor.html?c=line-simple&code=PYBwLglsB2AEC8BvAsAKFh2AiMxgBtIQsAuWFdTKnAJwgHN6BTG07CMJgWyzSoF8ANH0xZ8TZtAAmbClWoBnJuIDGnKQFlgUpmwBmAQ3xLhledgUALYAHc2YGgFcmp8xhyg2WAKwBSLK5uWHT0lmBeAMwADP6B5lg2EFJgll4AjFExASLxlkwMYemZsTnyOEwAHmAAymAAnuKypW7YKgTArGRYAMR6ff3ZZi3YejA1EABeumQATGkAdBFLyysrM82YQhvuUgZgBmwA2tvycsPx0AZc09iAAHKA5X6D5_EQbdBeEFwGzCQA9L9hMAgP6_fDAFRGawKMAkACc3hmAA5ftC9q9fp9vkwFBi3gB9GhMKQAARmFXmIGg9Cez2onCqtQaNzOtPibTBnWwvX6fV4Q1p_BOAjiwxZrKwl2uXkAMXKPEW0rCvGAfL4_f6A4H_MEQ_BQmHwpEo_aQFQY1XY3EwPF1ZRgmyk8mU6ny57lBn1RpkMWs0Tsjpebk8vk-jCC_luLbh8ze12Sm5YQCQcnKhUEle8upi1QCwECQdrIcBoXCEcjUSazVicWm8QAjfDOB0Uqk0n1umoe5kp85YP2cno83ld-RhgUnAC6pUj1HodBkXpOwQK4S6GRKUew4j0y-wfhbZTyS68iKyLvcuGIXWia5aPbGBgg0AAMgYa8p7E4mJORVgKgBBCoQAoTTrlgVi2PoRgmAu9QgPGABuRjOHuiggPgHCPg-nbroo1h2GQhjGJ-65TkEBgAQoAAqrwANbAQqYF4bABFKCcJHxGRgEYdAWH0bhEGEaxp7YBxCjPq--B0a6DHvs4QnUKM0DjFMbBzIsqzqUsMxyb67R9oGAysV-pRYHU_6AZJ8S7PsRxDlggAbyoArK7IUEDmANlKwZuGOQk4HUsF eBCnD0B0dTOe4 CioehmEWcMoF8fhkFES0bFlCJVEqLR87YaI0nxQJxHeSJXE8VJcVMQlgkLoVL5vplCoKUpNyqRpGlabZvYBgOegeeYI6bN-Sh0NiNnrjGFxXPGDyhWUMHxjWBisNpYX7OlXi4PsEmLdgc00AA4gYF6wBkm1YNtADCewSMFe0HUdtnbQA6kkKRsGkERqc1azHRw3CMp65BDtQoAGCoHAhWQaRDslN74NVEm1SGsXgWQDiyQDoggIWHBQOmsDHFl3beCeaPmAAtDMb0fas6z4_IXnEyMYzVJMjULJTn307eHIdQO3XDFDQRWQcZB4yGsCE5tVDi_ThNDhO-UnKNZRxl4U10r5s3zarogPU9qTgwAbPr8yGybptm8dqIrV0a1GFr7gTGwURfZwXC_cVrbtV0ND0HNAAUMzeN4ghO07aQAJR22UQMg_UjuQ8dgvDaLt001QKfJ1EssVSNtnK10sqRz5fldNtheWxl2A2xtd3zY9yR64dFNs5pzs_R20UKtHoMvfHtkw-JHclUjsAoy4HMYwoWPKsL9PUIT16i5gZNN831Oi3TqeiPVTPKbMrPNxErWb-4ntcjzvc01gicz8fh2ZBLmAZE79NP1n8s55fefYIXM1eKXx063ri9Q2xszZgMNhbZaFcPDrULg7Mgz9L7fVdu3eGHtdJeG9n7AOQcQ6CHDpHQGIBgbdwQRfBU19cYv0QRnB-GAMhvySkJRW1Av6JmTJfX-JdNaQOBtAquhdAHPXBivNmR8FTILdoPbsXdY7g3Ia6fuNV_q30RoxUedDsATynjjEWi93Dz0IW4Ze70xH0w3qLLA29mYqX3qvTRnN_RdH0l1BR3ZKF6J9MeTR3j6bHkYRGZhudxoq2OlwrRrxcB0CMAAIR4bZBQdQuA1gIP5CANAVCNAtkklJ-AABKwBjQ3DSL4y-iTkkEB3jcTxrIMigPAWAzRr1TGUzXs8CxUkckEAAPJ9CUNuGptIj YNPAZozONMOndkkag lRljZFg0Om4mKSi4bkH5vEcpuSAAKmNIDTwsPsGg4QE57CFlQ2-NCQyXJ9OM2kcsmEK2CVKLoP91ZeBAJEjoEBYnxLKV0_AVSk4hjqSMxpL9RGtNltkip-TCkXReqU-i_zel6H6UCn0wzQWmzGVChJ_ydmTz2TjLATBpBwJeuI100ymTSJivMnuNN1llA8dLa5rIpa3xlhM7OLQWGiDYa84uES1BfJ-QtPFMK0kZKyRK3JBSikIrZTeTZlSbE3wzvUrF-smkQo-m084kyYoqvwCitF6qQyYq1dq-mtz2nHXgYdSlUyXZSLQeKel8jGXHRWbIJlih8W7Oxl4UlMgTnWXNRipVzx9ZRvODGgJPUgmfxCS8sJbyugfJFdE_AcTxV_JhYCiNtSoiaqxTqlpercX5rlXCzgiroW5NNUwAZ9NLVapxRMhtBACU6ODWS-1FLW4oJpW6zuxCY4LIhl62yLLb5pBjU0hdL943cvfryp58ZBXxkzVE75ObflIslV0EG0rdBdthQq8GiLOkFrVecjVVqIHgorc1fVwxDXKuRX05t6LWRtrLTaqtCoHVpCdTFalf0-XxA9Ys6dl8fVej9dlANhKg1dBDYXWdycADssbhhpFw003DCbhxJoVAKtNQqsA7tFfuvNh7cmFvvcCktj7rVzt1a-oDN6a2XsOte7sxqm0ttvv-0FHa7nnp7USvtobbIgbAzeCD7t3XjtIbBgUYazmDOeAHPDLQ9OaL0yR4Ujzk3PO_pR7dnzs25rLv8pjOnzggsfeWg-h9uOCf-fK-FV79PIZhcJ39QzS3icA522V3bA37JJf2-Tg7bLKdpTeGDU7NMztOcF3TS7b4zBy6LPLtqDXethsloIOUR4fgcVIQC-xoAqGKf5tkGDnEDAcdY3e_HQsNIACwOO0TJr2h5IaGSGHLfgQA)  ### Current Behavior A special line appears to display the pictorialBar ### Expected Behavior Does not appear ### Environment ```markdown - OS: -Browser: - Framework: ``` ### Any additional comments? _No response_ -- This is an automated message from the Apache Git Service. To respond to the message, please log on to GitHub and use the URL above to go to the specific comment. To unsubscribe, e-mail: commits-unsubscr...@echarts.apache.org For queries about this service, please contact Infrastructure at: us...@infra.apache.org - To unsubscribe, e-mail: commits-unsubscr...@echarts.apache.org For additional commands, e-mail: commits-h...@echarts.apache.org
[GitHub] [echarts] iamsee opened a new issue, #18184: [Bug] A special line will appear when bar and pictorialBar are used together
iamsee opened a new issue, #18184: URL: https://github.com/apache/echarts/issues/18184 ### Version 5.4.1 ### Link to Minimal Reproduction _No response_ ### Steps to Reproduce [复现地址](https://echarts.apache.org/examples/zh/editor.html?c=line-simple&code=PYBwLglsB2AEC8BvAsAKFh2AiMxgBtIQsAuWFdTKnAJwgHN6BTG07CMJgWyzSoF8ANH0xZ8TZtAAmbClWoBnJuIDGnKQFlgUpmwBmAQ3xLhledgUALYAHc2YGgFcmp8xhyg2WAKwBSLK5uWHT0lmBeAMwADP6B5lg2EFJgll4AjFExASLxlkwMYemZsTnyOEwAHmAAymAAnuKypW7YKgTArGRYAMR6ff3ZZi3YejA1EABeumQATGkAdBFLyysrM82YQhvuUgZgBmwA2tvycsPx0AZc09iAAHKA5X6D5_EQbdBeEFwGzCQA9L9hMAgP6_fDAFRGawKMAkACc3hmAA5ftC9q9fp9vkwFBi3gB9GhMKQAARmFXmIGg9Cez2onCqtQaNzOtPibTBnWwvX6fV4Q1p_BOAjiwxZrKwl2uXkAMXKPEW0rCvGAfL4_f6A4H_MEQ_BQmHwpEo_aQFQY1XY3EwPF1ZRgmyk8mU6ny57lBn1RpkMWs0Tsjpebk8vk-jCC_luLbh8ze12Sm5YQCQcnKhUEle8upi1QCwECQdrIcBoXCEcjUSazVicWm8QAjfDOB0Uqk0n1umoe5kp85YP2cno83ld-RhgUnAC6pUj1HodBkXpOwQK4S6GRKUew4j0y-wfhbZTyS68iKyLvcuGIXWia5aPbGBgg0AAMgYa8p7E4mJORVgKgBBCoQAoTTrlgVi2PoRgmAu9QgPGABuRjOHuiggPgHCPg-nbroo1h2GQhjGJ-65TkEBgAQoAAqrwANbAQqYF4bABFKCcJHxGRgEYdAWH0bhEGEaxp7YBxCjPq--B0a6DHvs4QnUKM0DjFMbBzIsqzqUsMxyb67R9oGAysV-pRYHU_6AZJ8S7PsRxDlggAbyoArK7IUEDmANlKwZuGOQk4HUsF eBCnD0B0dTOe4CioehmEWcMoF8fhkFES0bFlCJVEqLR87YaI0nxQJxHeSJXE8VJcVMQlgkLoVL5vplCoKUpNyqRpGlabZvYBgOegeeYI6bN-Sh0NiNnrjGFxXPGDyhWUMHxjWBisNpYX7OlXi4PsEmLdgc00AA4gYF6wBkm1YNtADCewSMFe0HUdtnbQA6kkKRsGkERqc1azHRw3CMp65BDtQoAGCoHAhWQaRDslN74NVEm1SGsXgWQDiyQDoggIWHBQOmsDHFl3beCeaPmAAtDMb0fas6z4_IXnEyMYzVJMjULJTn307eHIdQO3XDFDQRWQcZB4yGsCE5tVDi_ThNDhO-UnKNZRxl4U10r5s3zarogPU9qTgwAbPr8yGybptm8dqIrV0a1GFr7gTGwURfZwXC_cVrbtV0ND0HNAAUMzeN4ghO07aQAJR22UQMg_UjuQ8dgvDaLt001QKfJ1EssVSNtnK10sqRz5fldNtheWxl2A2xtd3zY9yR64dFNs5pzs_R20UKtHoMvfHtkw-JHclUjsAoy4HMYwoWPKsL9PUIT16i5gZNN831Oi3TqeiPVTPKbMrPNxErWb-4ntcjzvc01gicz8fh2ZBLmAZE79NP1n8s55fefYIXM1eKXx063ri9Q2xszZgMNhbZaFcPDrULg7Mgz9L7fVdu3eGHtdJeG9n7AOQcQ6CHDpHQGIBgbdwQRfBU19cYv0QRnB-GAMhvySkJRW1Av6JmTJfX-JdNaQOBtAquhdAHPXBivNmR8FTILdoPbsXdY7g3Ia6fuNV_q30RoxUedDsATynjjEWi93Dz0IW4Ze70xH0w3qLLA29mYqX3qvTRnN_RdH0l1BR3ZKF6J9MeTR3j6bHkYRGZhudxoq2OlwrRrxcB0CMAAIR4bZBQdQuA1gIP5CANAVCNAtkklJ-AABKwBjQ3DSL4y-iTkkEB3jcTxrIMigPAWAzRr1TGUzXs8CxUkckEAAPJ9CUNuGptIjY NPAZozONMOndkkaglRljZFg0Om4mKSi4bkH5vEcpuSAAKmNIDTwsPsGg4QE57CFlQ2-NCQyXJ9OM2kcsmEK2CVKLoP91ZeBAJEjoEBYnxLKV0_AVSk4hjqSMxpL9RGtNltkip-TCkXReqU-i_zel6H6UCn0wzQWmzGVChJ_ydmTz2TjLATBpBwJeuI100ymTSJivMnuNN1llA8dLa5rIpa3xlhM7OLQWGiDYa84uES1BfJ-QtPFMK0kZKyRK3JBSikIrZTeTZlSbE3wzvUrF-smkQo-m084kyYoqvwCitF6qQyYq1dq-mtz2nHXgYdSlUyXZSLQeKel8jGXHRWbIJlih8W7Oxl4UlMgTnWXNRipVzx9ZRvODGgJPUgmfxCS8sJbyugfJFdE_AcTxV_JhYCiNtSoiaqxTqlpercX5rlXCzgiroW5NNUwAZ9NLVapxRMhtBACU6ODWS-1FLW4oJpW6zuxCY4LIhl62yLLb5pBjU0hdL943cvfryp58ZBXxkzVE75ObflIslV0EG0rdBdthQq8GiLOkFrVecjVVqIHgorc1fVwxDXKuRX05t6LWRtrLTaqtCoHVpCdTFalf0-XxA9Ys6dl8fVej9dlANhKg1dBDYXWdycADssbhhpFw003DCbhxJoVAKtNQqsA7tFfuvNh7cmFvvcCktj7rVzt1a-oDN6a2XsOte7sxqm0ttvv-0FHa7nnp7USvtobbIgbAzeCD7t3XjtIbBgUYazmDOeAHPDLQ9OaL0yR4Ujzk3PO_pR7dnzs25rLv8pjOnzggsfeWg-h9uOCf-fK-FV79PIZhcJ39QzS3icA522V3bA37JJf2-Tg7bLKdpTeGDU7NMztOcF3TS7b4zBy6LPLtqDXethsloIOUR4fgcVIQC-xoAqGKf5tkGDnEDAcdY3e_HQsNIACwOO0TJr2h5IaGSGHLfgQA)  ### Current Behavior A special line appears to display the pictorialBar ### Expected Behavior Does not appear ### Environment ```markdown - OS: - Browser: - Framework: ``` ### Any additional comments? _No response_ -- This is an automated message from the Apache Git Service. To respond to the message, please log on to GitHub and use the URL above to go to the specific comment. To unsubscribe, e-mail: commits-unsubscr...@echarts.apache.org.apache.org For queries about this service, please contact Infrastructure at: us...@infra.apache.org - To unsubscribe, e-mail: commits-unsubscr...@echarts.apache.org For additional commands, e-mail: commits-h...@echarts.apache.org
[GitHub] [echarts] Jordi-LG commented on issue #16709: [Bug] package.json is missing a package "type": "module" description
Jordi-LG commented on issue #16709:
URL: https://github.com/apache/echarts/issues/16709#issuecomment-1385557124

   Hi, any updates for the issue ? I'm also stuck and got this error when i
tried to compil my app.

   `import * as echarts from 'echarts'` with echarts 5.4.1

   ```
   export * from './lib/export/charts.js';
   ^^

   SyntaxError: Unexpected token 'export'
   at wrapSafe (internal/modules/cjs/loader.js:1001:16)
   at Module._compile (internal/modules/cjs/loader.js:1049:27)
   at Object.Module._extensions..js (internal/modules/cjs/loader.js:1114:10)
   at Module.load (internal/modules/cjs/loader.js:950:32)
   at Function.Module._load (internal/modules/cjs/loader.js:790:12)
   at Module.require (internal/modules/cjs/loader.js:974:19)
   at require (internal/modules/cjs/helpers.js:101:18)
   ```


--
This is an automated message from the Apache Git Service.
To respond to the message, please log on to GitHub and use the
URL above to go to the specific comment.

To unsubscribe, e-mail: commits-unsubscr...@echarts.apache.org

For queries about this service, please contact Infrastructure at:
us...@infra.apache.org


-
To unsubscribe, e-mail: commits-unsubscr...@echarts.apache.org
For additional commands, e-mail: commits-h...@echarts.apache.org
[GitHub] [echarts] plainheart commented on issue #18180: [Bug] Height Exceeds 65535px Error
plainheart commented on issue #18180:
URL: https://github.com/apache/echarts/issues/18180#issuecomment-1385490105

   This is up to the limit of the browser, and it's not related to ECharts.


--
This is an automated message from the Apache Git Service.
To respond to the message, please log on to GitHub and use the
URL above to go to the specific comment.

To unsubscribe, e-mail: commits-unsubscr...@echarts.apache.org

For queries about this service, please contact Infrastructure at:
us...@infra.apache.org


-
To unsubscribe, e-mail: commits-unsubscr...@echarts.apache.org
For additional commands, e-mail: commits-h...@echarts.apache.org
[GitHub] [echarts] plainheart closed issue #18180: [Bug] Height Exceeds 65535px Error
plainheart closed issue #18180: [Bug] Height Exceeds 65535px Error
URL: https://github.com/apache/echarts/issues/18180


--
This is an automated message from the Apache Git Service.
To respond to the message, please log on to GitHub and use the
URL above to go to the specific comment.

To unsubscribe, e-mail: commits-unsubscr...@echarts.apache.org

For queries about this service, please contact Infrastructure at:
us...@infra.apache.org


-
To unsubscribe, e-mail: commits-unsubscr...@echarts.apache.org
For additional commands, e-mail: commits-h...@echarts.apache.org
[GitHub] [echarts] wqzwh commented on issue #18181: [Bug] 折线图中当数据全部为100、200、300、以此类推,折线图显示存在问题
wqzwh commented on issue #18181:
URL: https://github.com/apache/echarts/issues/18181#issuecomment-1385184705

   https://user-images.githubusercontent.com/16662470/212876240-a7556c27-896a-4a3b-802d-b56dd53959c7.png";>
   https://user-images.githubusercontent.com/16662470/212876338-125f1213-1773-435b-984a-4ecc26929e27.png";>

   如果使用max,这个分割比例是变化的,所以无法精确max的值,期望是ec内部可以计算 @zhonghuaifang


--
This is an automated message from the Apache Git Service.
To respond to the message, please log on to GitHub and use the
URL above to go to the specific comment.

To unsubscribe, e-mail: commits-unsubscr...@echarts.apache.org

For queries about this service, please contact Infrastructure at:
us...@infra.apache.org


-
To unsubscribe, e-mail: commits-unsubscr...@echarts.apache.org
For additional commands, e-mail: commits-h...@echarts.apache.org
[GitHub] [echarts] zhonghuaifang commented on issue #18181: [Bug] 折线图中当数据全部为100、200、300、以此类推,折线图显示存在问题
zhonghuaifang commented on issue #18181:
URL: https://github.com/apache/echarts/issues/18181#issuecomment-1385047963

   @wqzwh [https://echarts.apache.org/zh/option.html#yAxis.max](url)


--
This is an automated message from the Apache Git Service.
To respond to the message, please log on to GitHub and use the
URL above to go to the specific comment.

To unsubscribe, e-mail: commits-unsubscr...@echarts.apache.org

For queries about this service, please contact Infrastructure at:
us...@infra.apache.org


-
To unsubscribe, e-mail: commits-unsubscr...@echarts.apache.org
For additional commands, e-mail: commits-h...@echarts.apache.org
[GitHub] [echarts] echarts-bot[bot] commented on issue #18183: [Feature] xAxis.axisLabel.formatter 的分级模板按季度
echarts-bot[bot] commented on issue #18183:
URL: https://github.com/apache/echarts/issues/18183#issuecomment-1385015179

   @zhonghuaifang It seems you are not using English, I've helped translate the
content automatically. To make your issue understood by more people and get
helped, we'd like to suggest using English next time. 🤗
   TRANSLATED

   **TITLE**

   [Feature] Grading template for xAxis.axisLabel.formatter by quarter

   **BODY**

   ### What problem does this feature solve?

   Can the `grading template` of xAxis.axisLabel.formatter add quarterly grading

   ### What does the proposed API look like?

   [https://echarts.apache.org/zh/option.html#xAxis.axisLabel.formatter](url)


--
This is an automated message from the Apache Git Service.
To respond to the message, please log on to GitHub and use the
URL above to go to the specific comment.

To unsubscribe, e-mail: commits-unsubscr...@echarts.apache.org

For queries about this service, please contact Infrastructure at:
us...@infra.apache.org


-
To unsubscribe, e-mail: commits-unsubscr...@echarts.apache.org
For additional commands, e-mail: commits-h...@echarts.apache.org
[GitHub] [echarts] zhonghuaifang opened a new issue, #18183: [Feature] xAxis.axisLabel.formatter 的分级模板按季度
zhonghuaifang opened a new issue, #18183:
URL: https://github.com/apache/echarts/issues/18183

   ### What problem does this feature solve?

   xAxis.axisLabel.formatter 的`分级模板`能加入按季度分级吗

   ### What does the proposed API look like?

   [https://echarts.apache.org/zh/option.html#xAxis.axisLabel.formatter](url)


--
This is an automated message from the Apache Git Service.
To respond to the message, please log on to GitHub and use the
URL above to go to the specific comment.

To unsubscribe, e-mail: commits-unsubscr...@echarts.apache.org.apache.org

For queries about this service, please contact Infrastructure at:
us...@infra.apache.org


-
To unsubscribe, e-mail: commits-unsubscr...@echarts.apache.org
For additional commands, e-mail: commits-h...@echarts.apache.org
[GitHub] [echarts] zhonghuaifang opened a new issue, #18182: [Feature]
zhonghuaifang opened a new issue, #18182:
URL: https://github.com/apache/echarts/issues/18182

   ### What problem does this feature solve?

   xAxis.axisLabel.formatter 的`分级模板`能加入`quarter`按季度吗

   ### What does the proposed API look like?

   [https://echarts.apache.org/zh/option.html#xAxis.axisLabel.formatter](url)


--
This is an automated message from the Apache Git Service.
To respond to the message, please log on to GitHub and use the
URL above to go to the specific comment.

To unsubscribe, e-mail: commits-unsubscr...@echarts.apache.org.apache.org

For queries about this service, please contact Infrastructure at:
us...@infra.apache.org


-
To unsubscribe, e-mail: commits-unsubscr...@echarts.apache.org
For additional commands, e-mail: commits-h...@echarts.apache.org
[GitHub] [echarts] echarts-bot[bot] closed issue #18182: [Feature]
echarts-bot[bot] closed issue #18182: [Feature]
URL: https://github.com/apache/echarts/issues/18182


--
This is an automated message from the Apache Git Service.
To respond to the message, please log on to GitHub and use the
URL above to go to the specific comment.

To unsubscribe, e-mail: commits-unsubscr...@echarts.apache.org

For queries about this service, please contact Infrastructure at:
us...@infra.apache.org


-
To unsubscribe, e-mail: commits-unsubscr...@echarts.apache.org
For additional commands, e-mail: commits-h...@echarts.apache.org
[GitHub] [echarts] wqzwh commented on issue #18181: [Bug] 折线图中当数据全部为100、200、300、以此类推,折线图显示存在问题
wqzwh commented on issue #18181:
URL: https://github.com/apache/echarts/issues/18181#issuecomment-1385000755

   这是我期望的效果,不至于线贴在顶部。
   https://user-images.githubusercontent.com/16662470/212844413-95b72ed0-2a63-474c-9519-55e69ad397d6.png";>


--
This is an automated message from the Apache Git Service.
To respond to the message, please log on to GitHub and use the
URL above to go to the specific comment.

To unsubscribe, e-mail: commits-unsubscr...@echarts.apache.org

For queries about this service, please contact Infrastructure at:
us...@infra.apache.org


-
To unsubscribe, e-mail: commits-unsubscr...@echarts.apache.org
For additional commands, e-mail: commits-h...@echarts.apache.org
[GitHub] [echarts] helgasoft commented on issue #18181: [Bug] 折线图中当数据全部为100、200、300、以此类推,折线图显示存在问题
helgasoft commented on issue #18181: URL: https://github.com/apache/echarts/issues/18181#issuecomment-1384980562 Use _grid.height_ and _yAxis.interval_ for better looking chart - [Demo Code](https://echarts.apache.org/examples/en/editor.html?c=line-simple&code=PYBwLglsB2AEC8sDeBYAULWAPAgliAzgFzLqaZgCeIApiQOQDGAhmDQObABOl9ANGXIATVsxIBtegFkY_WPQAqAVxpz6AdRpC1CgBZK1AMS4Q1AZVbml0egF1BAXwEZYlPIRKoXFanXkA3ZgAbFTkIaDYuQKCSAFYABkdnTHYTIU9dGgh2XTA4-KdBAhoTGmJYcUFML3JhUQkARnj4vlgmlrbm1vburs6O9ttk2tgqWgYg8NVhzAdBezQHAG4gA)  -- This is an automated message from the Apache Git Service. To respond to the message, please log on to GitHub and use the URL above to go to the specific comment. To unsubscribe, e-mail: commits-unsubscr...@echarts.apache.org For queries about this service, please contact Infrastructure at: us...@infra.apache.org - To unsubscribe, e-mail: commits-unsubscr...@echarts.apache.org For additional commands, e-mail: commits-h...@echarts.apache.org
[GitHub] [echarts-handbook] Ovilia merged pull request #86: doc: add ssr+csr solution
Ovilia merged PR #86:
URL: https://github.com/apache/echarts-handbook/pull/86


--
This is an automated message from the Apache Git Service.
To respond to the message, please log on to GitHub and use the
URL above to go to the specific comment.

To unsubscribe, e-mail: commits-unsubscr...@echarts.apache.org

For queries about this service, please contact Infrastructure at:
us...@infra.apache.org


-
To unsubscribe, e-mail: commits-unsubscr...@echarts.apache.org
For additional commands, e-mail: commits-h...@echarts.apache.org
[GitHub] [echarts] helgasoft commented on issue #18177: [Bug] Line graph animation waiting so long cause animationDuration is also working on blank data
helgasoft commented on issue #18177:
URL: https://github.com/apache/echarts/issues/18177#issuecomment-1384955590

   Where is the _blank data_? Shouldn't it be
   ```data: [null, null, null, null, null, ..., 218, 135, 147, 260].map((o,
index) => [index, o])```
   But even then it all depends on **animationDuration**.
   With ```animationDuration=200``` drawing is almost instant.
   I think it works as documented.


--
This is an automated message from the Apache Git Service.
To respond to the message, please log on to GitHub and use the
URL above to go to the specific comment.

To unsubscribe, e-mail: commits-unsubscr...@echarts.apache.org

For queries about this service, please contact Infrastructure at:
us...@infra.apache.org


-
To unsubscribe, e-mail: commits-unsubscr...@echarts.apache.org
For additional commands, e-mail: commits-h...@echarts.apache.org
[GitHub] [echarts] echarts-bot[bot] commented on issue #18181: [Bug] 折线图中当数据全部为100、200、300、以此类推,折线图显示存在问题
echarts-bot[bot] commented on issue #18181:
URL: https://github.com/apache/echarts/issues/18181#issuecomment-1384948962

   @wqzwh It seems you are not using English, I've helped translate the content
automatically. To make your issue understood by more people and get helped,
we'd like to suggest using English next time. 🤗
   TRANSLATED

   **TITLE**

   [Bug] When the data in the line chart is all 100, 200, 300, and so on, the
line chart shows that there is a problem

   **BODY**

   ### Version

   5.4.1

   ### Link to Minimal Reproduction

   _No response_

   ### Steps to Reproduce

   ```
   option = {
 xAxis: {
   type: 'category',
   data: ['Mon', 'Tue', 'Wed', 'Thu', 'Fri', 'Sat', 'Sun']
 },
 yAxis: {
   type: 'value',
 },
 series: [
   {
 data: [100, 100, 100, 100, 100, 100, 100],
 type: 'line',
 smooth: true,
   }
 ]
   };
   ```
   https://user-images.githubusercontent.com/16662470/212837037-8d32c031-dba8-4077-a9b1-9c3c7e144ccd.png";>


   ### Current Behavior

   When the data sets are 100, 200, 300, etc., the line chart display will be
pasted on the top. I understand that the division of the y-axis should be
automatically calculated

   ### Expected Behavior

   https://user-images.githubusercontent.com/16662470/212837037-8d32c031-dba8-4077-a9b1-9c3c7e144ccd.png";>


   ### Environment

   ```markdown
   - OS:
   -Browser:
   - Framework:
   ```


   ### Any additional comments?

   _No response_


--
This is an automated message from the Apache Git Service.
To respond to the message, please log on to GitHub and use the
URL above to go to the specific comment.

To unsubscribe, e-mail: commits-unsubscr...@echarts.apache.org

For queries about this service, please contact Infrastructure at:
us...@infra.apache.org


-
To unsubscribe, e-mail: commits-unsubscr...@echarts.apache.org
For additional commands, e-mail: commits-h...@echarts.apache.org
[GitHub] [echarts] wqzwh opened a new issue, #18181: [Bug] 折线图中当数据全部为100、200、300、以此类推,折线图显示存在问题
wqzwh opened a new issue, #18181:
URL: https://github.com/apache/echarts/issues/18181

   ### Version

   5.4.1

   ### Link to Minimal Reproduction

   _No response_

   ### Steps to Reproduce

   ```
   option = {
 xAxis: {
   type: 'category',
   data: ['Mon', 'Tue', 'Wed', 'Thu', 'Fri', 'Sat', 'Sun']
 },
 yAxis: {
   type: 'value',
 },
 series: [
   {
 data: [100, 100, 100, 100, 100, 100, 100],
 type: 'line',
 smooth: true,
   }
 ]
   };
   ```
   https://user-images.githubusercontent.com/16662470/212837037-8d32c031-dba8-4077-a9b1-9c3c7e144ccd.png";>


   ### Current Behavior

   当数据集都是100、200、300等等的时候,折线图显示会贴在顶部,我理解y轴的分割应该会自动计算的

   ### Expected Behavior

   https://user-images.githubusercontent.com/16662470/212837037-8d32c031-dba8-4077-a9b1-9c3c7e144ccd.png";>


   ### Environment

   ```markdown
   - OS:
   - Browser:
   - Framework:
   ```


   ### Any additional comments?

   _No response_


--
This is an automated message from the Apache Git Service.
To respond to the message, please log on to GitHub and use the
URL above to go to the specific comment.

To unsubscribe, e-mail: commits-unsubscr...@echarts.apache.org.apache.org

For queries about this service, please contact Infrastructure at:
us...@infra.apache.org


-
To unsubscribe, e-mail: commits-unsubscr...@echarts.apache.org
For additional commands, e-mail: commits-h...@echarts.apache.org
[GitHub] [echarts] biscuit214 opened a new issue, #18180: [Bug] Height Exceeds 65535px Error
biscuit214 opened a new issue, #18180: URL: https://github.com/apache/echarts/issues/18180 ### Version 5.4.1 ### Link to Minimal Reproduction https://codesandbox.io/s/basic-bar-forked-74z08m?file=/style.css ### Steps to Reproduce 1.Use the following link to create, has error example https://codesandbox.io/s/basic-bar-forked-74z08m?file=/style.css 2.Replacing [height: 65536px] for [height: 1000px], Back to normal. ### Current Behavior ECharts height exceeds 65535px will report an error some computers in 59353px will report an error  ### Expected Behavior Expected 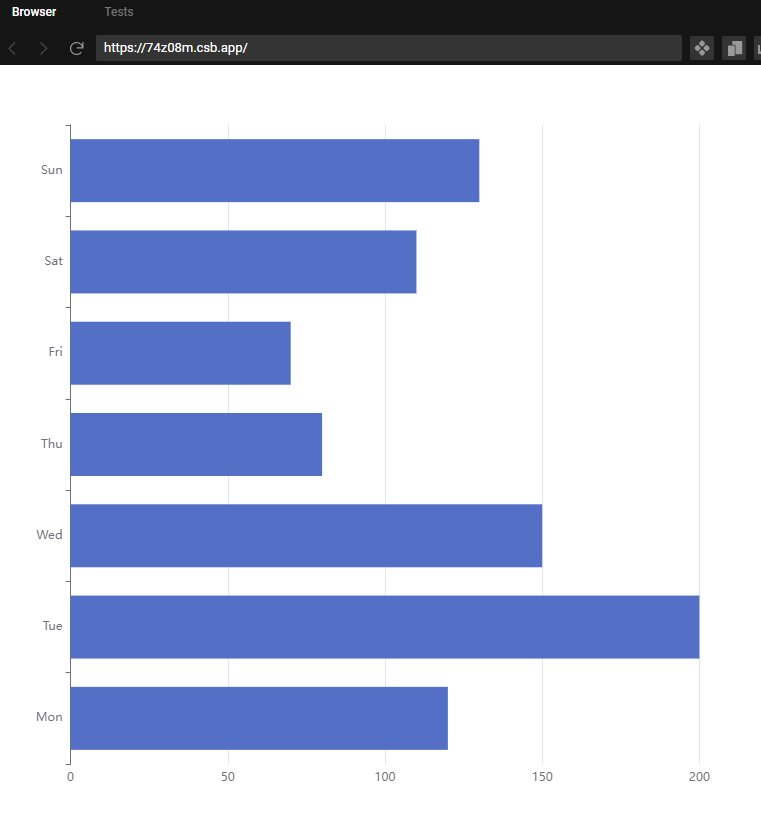 ### Environment ```markdown - OS: Windows 10 - Browser: Chrome 108.0.5359.125 - Framework: ``` ### Any additional comments? _No response_ -- This is an automated message from the Apache Git Service. To respond to the message, please log on to GitHub and use the URL above to go to the specific comment. To unsubscribe, e-mail: commits-unsubscr...@echarts.apache.org.apache.org For queries about this service, please contact Infrastructure at: us...@infra.apache.org - To unsubscribe, e-mail: commits-unsubscr...@echarts.apache.org For additional commands, e-mail: commits-h...@echarts.apache.org
[GitHub] [echarts] kubichengxuyuan opened a new issue, #18179: [Bug] Event Trigger valid click Event as Mousedown Event
kubichengxuyuan opened a new issue, #18179:
URL: https://github.com/apache/echarts/issues/18179

   ### Version

   5.3.0

   ### Link to Minimal Reproduction

   _No response_

   ### Steps to Reproduce

   1. normal create
   2. toolBox

   ### Current Behavior

   click toolBox Can't callback onclick Event

   ### Expected Behavior

   open a lots of tabs

   ### Environment

   ```markdown
   - OS:
   - Browser:
   - Framework:
   ```


   ### Any additional comments?

   _No response_


--
This is an automated message from the Apache Git Service.
To respond to the message, please log on to GitHub and use the
URL above to go to the specific comment.

To unsubscribe, e-mail: commits-unsubscr...@echarts.apache.org.apache.org

For queries about this service, please contact Infrastructure at:
us...@infra.apache.org


-
To unsubscribe, e-mail: commits-unsubscr...@echarts.apache.org
For additional commands, e-mail: commits-h...@echarts.apache.org
[GitHub] [echarts] cqcpcqp commented on issue #6928: 与iscroll同用时无法点击图表(pointer事件兼容性判断和chrome更新所致)
cqcpcqp commented on issue #6928:
URL: https://github.com/apache/echarts/issues/6928#issuecomment-1384884511

   iscroll 5.2.0


--
This is an automated message from the Apache Git Service.
To respond to the message, please log on to GitHub and use the
URL above to go to the specific comment.

To unsubscribe, e-mail: commits-unsubscr...@echarts.apache.org

For queries about this service, please contact Infrastructure at:
us...@infra.apache.org


-
To unsubscribe, e-mail: commits-unsubscr...@echarts.apache.org
For additional commands, e-mail: commits-h...@echarts.apache.org
[GitHub] [echarts-handbook] Ovilia opened a new pull request, #86: doc: add ssr+csr solution
Ovilia opened a new pull request, #86:
URL: https://github.com/apache/echarts-handbook/pull/86

   Add the document for the ssr+csr solution.

   I changed the original title `Server-Side String-based SVG Rendering` to
`Server-Side SVG Rendering` to make it more symmetry with Canvas. I think the
detail of "string-based" should be introduced in the next paragraphs. @pissang
Please help check if it's OK. Thanks!


--
This is an automated message from the Apache Git Service.
To respond to the message, please log on to GitHub and use the
URL above to go to the specific comment.

To unsubscribe, e-mail: commits-unsubscr...@echarts.apache.org

For queries about this service, please contact Infrastructure at:
us...@infra.apache.org


-
To unsubscribe, e-mail: commits-unsubscr...@echarts.apache.org
For additional commands, e-mail: commits-h...@echarts.apache.org
[GitHub] [echarts] gzhong88 commented on issue #18175: [Bug] Heatmap does not show chart after a large no-data gap
gzhong88 commented on issue #18175: URL: https://github.com/apache/echarts/issues/18175#issuecomment-1384770779 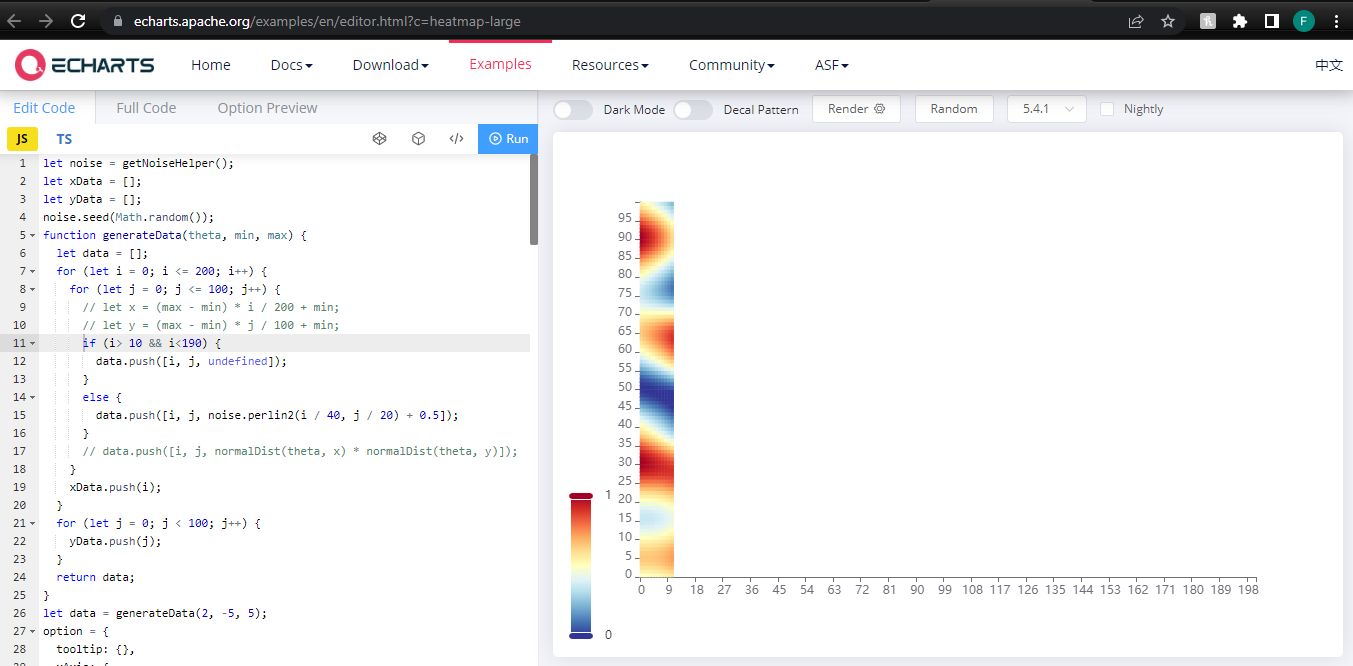 -- This is an automated message from the Apache Git Service. To respond to the message, please log on to GitHub and use the URL above to go to the specific comment. To unsubscribe, e-mail: commits-unsubscr...@echarts.apache.org For queries about this service, please contact Infrastructure at: us...@infra.apache.org - To unsubscribe, e-mail: commits-unsubscr...@echarts.apache.org For additional commands, e-mail: commits-h...@echarts.apache.org
[GitHub] [echarts] gzhong88 commented on issue #18175: [Bug] Heatmap does not show chart after a large no-data gap
gzhong88 commented on issue #18175:
URL: https://github.com/apache/echarts/issues/18175#issuecomment-1384767314


   To reproduce the problem, after you replaced the line 11 code in above step2
with the following code, then click on Run button. Let your mouse cursor stay
focused on the Run button. Do not move your mouse.
   (點擊Run按鈕之後,不要移動鼠標,這是Reproduce the problem的關鍵。)
   if (i> 10 && i<190) {
   data.push([i, j, undefined]);
   }
   else {
   data.push([i, j, noise.perlin2(i / 40, j / 20) + 0.5]);
   }
   Note: If you change above step2 from i<190 to i<120, and click Run button,
you will see a different behavior that the remaining chart will show up
automatically.
   On Monday, January 16, 2023 at 03:25:05 PM CST, Gong Zhong ***@***.***>
wrote:

 1. Use the following link to create the
heatmap:https://echarts.apache.org/examples/en/editor.html?c=heatmap-large
   2. Replacing line 11 in function generateData(theta, min, max) with  if (i>
10 && i<190) {    data.push([i, j, undefined]);  }  else {    data.push([i, j,
noise.perlin2(i / 40, j / 20) + 0.5]);  }
   3. Click on Run button above the code page on the left to regenerate the
chart. Let your mouse cursor focued on the Run button. Do not move your mouse,
which is Very Important!!
   Observed that chart between i >=190 and i <= 200 do not show up.
   Note: If you change above step2 from i<190 to i<120, and click Run button,
the remaining chart will show up automatically.

   On Monday, January 16, 2023 at 02:16:53 PM CST, Gong Zhong ***@***.***>
wrote:


  -
   If you cannot reproduce, try to set the no data gap bigger by changing i
<160 to i<190 as following, and try again.  Thanks.

  -
   Use the following link to create the heatmap:
   https://echarts.apache.org/examples/en/editor.html?c=heatmap-large

  -
   Replacing line 11 in function generateData(theta, min, max) with
   if (i> 10 && i<190) {
data.push([i, j, undefined]);

   }
   else {
   data.push([i, j, noise.perlin2(i / 40, j / 20) + 0.5]);
   }

   On Monday, January 16, 2023 at 01:13:58 AM CST, Wenli Zhang ***@***.***>
wrote:


   Cannot reproduce.


   Looks as expected to me.

   —
   Reply to this email directly, view it on GitHub, or unsubscribe.
   You are receiving this because you authored the thread.Message ID:
***@***.***>


--
This is an automated message from the Apache Git Service.
To respond to the message, please log on to GitHub and use the
URL above to go to the specific comment.

To unsubscribe, e-mail: commits-unsubscr...@echarts.apache.org

For queries about this service, please contact Infrastructure at:
us...@infra.apache.org


-
To unsubscribe, e-mail: commits-unsubscr...@echarts.apache.org
For additional commands, e-mail: commits-h...@echarts.apache.org
[GitHub] [echarts] gzhong88 commented on issue #18175: [Bug] Heatmap does not show chart after a large no-data gap
gzhong88 commented on issue #18175:
URL: https://github.com/apache/echarts/issues/18175#issuecomment-1384766409

   To reproduce the problem, after you replaced the line 11 code in above step2
with the following code, then click on Run button. Let your mouse cursor stay
focused on the Run button. Do not move your mouse.
   (點擊Run按鈕之後,不要移動鼠標,這是Reproduce the problem的關鍵。)
 if (i> 10 && i<190) {
   data.push([i, j, undefined]);
 }
 else {
   data.push([i, j, noise.perlin2(i / 40, j / 20) + 0.5]);
 }
   Note: If you change above step2 from i<190 to i<120, and click Run button,
you will see a different behavior that the remaining chart will show up
automatically.


--
This is an automated message from the Apache Git Service.
To respond to the message, please log on to GitHub and use the
URL above to go to the specific comment.

To unsubscribe, e-mail: commits-unsubscr...@echarts.apache.org

For queries about this service, please contact Infrastructure at:
us...@infra.apache.org


-
To unsubscribe, e-mail: commits-unsubscr...@echarts.apache.org
For additional commands, e-mail: commits-h...@echarts.apache.org
[GitHub] [echarts] gzhong88 commented on issue #18175: [Bug] Heatmap does not show chart after a large no-data gap
gzhong88 commented on issue #18175:
URL: https://github.com/apache/echarts/issues/18175#issuecomment-1384567865

1. Use the following link to create the
heatmap:https://echarts.apache.org/examples/en/editor.html?c=heatmap-large
   2. Replacing line 11 in function generateData(theta, min, max) with  if (i>
10 && i<190) {    data.push([i, j, undefined]);  }  else {    data.push([i, j,
noise.perlin2(i / 40, j / 20) + 0.5]);  }
   3. Click on Run button above the code page on the left to regenerate the
chart. Let your mouse cursor focued on the Run button. Do not move your mouse,
which is Very Important!!
   Observed that chart between i >=190 and i <= 200 do not show up.
   Note: If you change above step2 from i<190 to i<120, and click Run button,
the remaining chart will show up automatically.

   On Monday, January 16, 2023 at 02:16:53 PM CST, Gong Zhong ***@***.***>
wrote:


  -
   If you cannot reproduce, try to set the no data gap bigger by changing i
<160 to i<190 as following, and try again.  Thanks.

  -
   Use the following link to create the heatmap:
   https://echarts.apache.org/examples/en/editor.html?c=heatmap-large

  -
   Replacing line 11 in function generateData(theta, min, max) with
   if (i> 10 && i<190) {
data.push([i, j, undefined]);

   }
   else {
   data.push([i, j, noise.perlin2(i / 40, j / 20) + 0.5]);
   }

   On Monday, January 16, 2023 at 01:13:58 AM CST, Wenli Zhang ***@***.***>
wrote:


   Cannot reproduce.


   Looks as expected to me.

   —
   Reply to this email directly, view it on GitHub, or unsubscribe.
   You are receiving this because you authored the thread.Message ID:
***@***.***>


--
This is an automated message from the Apache Git Service.
To respond to the message, please log on to GitHub and use the
URL above to go to the specific comment.

To unsubscribe, e-mail: commits-unsubscr...@echarts.apache.org

For queries about this service, please contact Infrastructure at:
us...@infra.apache.org


-
To unsubscribe, e-mail: commits-unsubscr...@echarts.apache.org
For additional commands, e-mail: commits-h...@echarts.apache.org
[GitHub] [echarts] gzhong88 commented on issue #18175: [Bug] Heatmap does not show chart after a large no-data gap
gzhong88 commented on issue #18175:
URL: https://github.com/apache/echarts/issues/18175#issuecomment-1384515909

   If you cannot reproduce, try to set the no data gap bigger by changing i
<160 to i<190 as following, and try again.  Thanks.
   Replacing line 11 in function generateData(theta, min, max) with

   if (i> 10 && i<190) {
data.push([i, j, undefined]);
   }
   else {
data.push([i, j, noise.perlin2(i / 40, j / 20) + 0.5]);
   }


--
This is an automated message from the Apache Git Service.
To respond to the message, please log on to GitHub and use the
URL above to go to the specific comment.

To unsubscribe, e-mail: commits-unsubscr...@echarts.apache.org

For queries about this service, please contact Infrastructure at:
us...@infra.apache.org


-
To unsubscribe, e-mail: commits-unsubscr...@echarts.apache.org
For additional commands, e-mail: commits-h...@echarts.apache.org
[GitHub] [echarts] gzhong88 commented on issue #18175: [Bug] Heatmap does not show chart after a large no-data gap
gzhong88 commented on issue #18175:
URL: https://github.com/apache/echarts/issues/18175#issuecomment-1384513944


  -
   If you cannot reproduce, try to set the no data gap bigger by changing i
<160 to i<190 as following, and try again.  Thanks.

  -
   Use the following link to create the heatmap:
   https://echarts.apache.org/examples/en/editor.html?c=heatmap-large

  -
   Replacing line 11 in function generateData(theta, min, max) with
   if (i> 10 && i<190) {
data.push([i, j, undefined]);

   }
   else {
   data.push([i, j, noise.perlin2(i / 40, j / 20) + 0.5]);
   }

   On Monday, January 16, 2023 at 01:13:58 AM CST, Wenli Zhang ***@***.***>
wrote:


   Cannot reproduce.


   Looks as expected to me.

   —
   Reply to this email directly, view it on GitHub, or unsubscribe.
   You are receiving this because you authored the thread.Message ID:
***@***.***>


--
This is an automated message from the Apache Git Service.
To respond to the message, please log on to GitHub and use the
URL above to go to the specific comment.

To unsubscribe, e-mail: commits-unsubscr...@echarts.apache.org

For queries about this service, please contact Infrastructure at:
us...@infra.apache.org


-
To unsubscribe, e-mail: commits-unsubscr...@echarts.apache.org
For additional commands, e-mail: commits-h...@echarts.apache.org
[GitHub] [echarts] helgasoft commented on issue #18162: [Bug] 内存泄漏
helgasoft commented on issue #18162: URL: https://github.com/apache/echarts/issues/18162#issuecomment-1384477690 could not reproduce, my JS Heap is lifelessly flat. 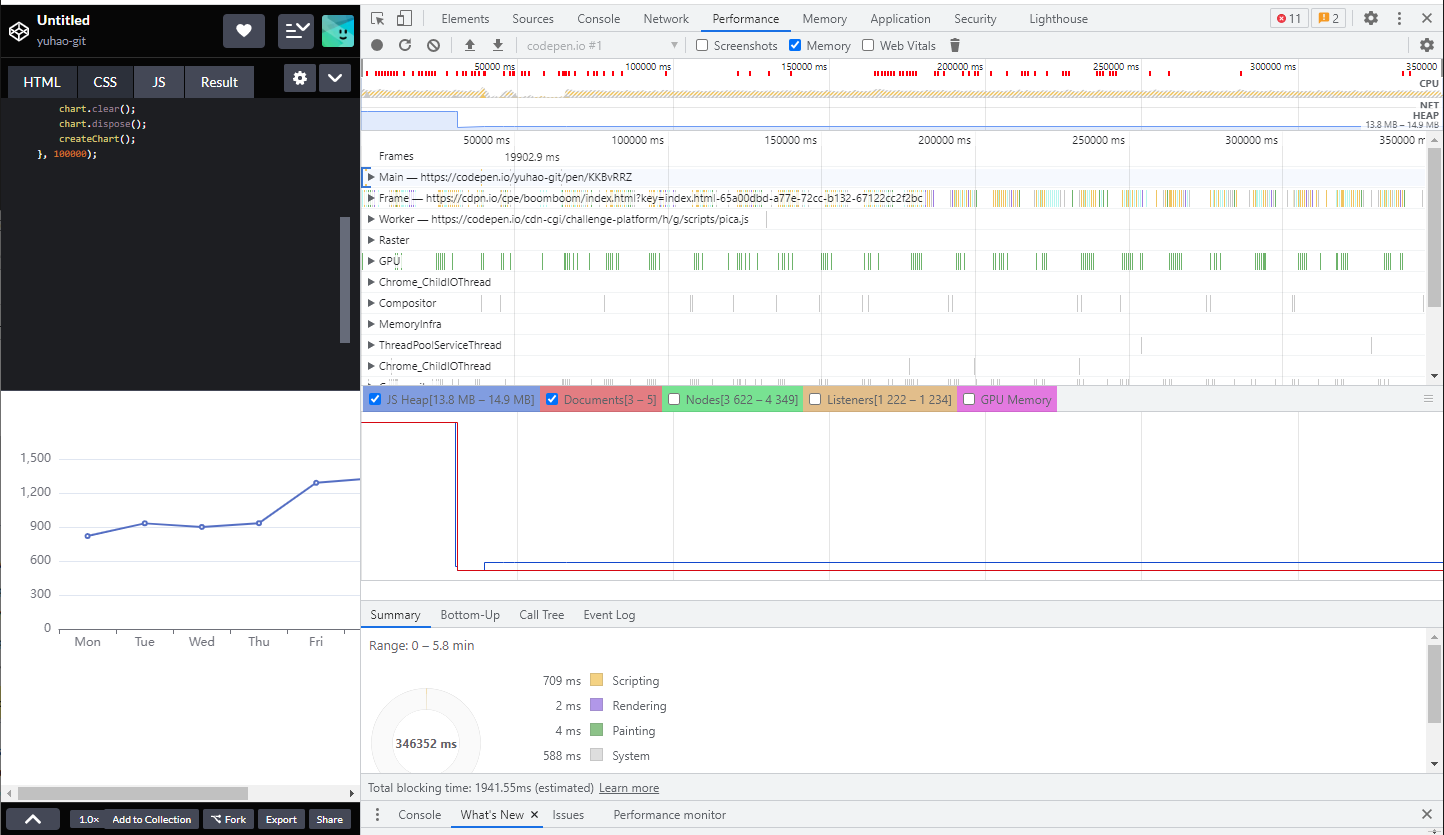 -- This is an automated message from the Apache Git Service. To respond to the message, please log on to GitHub and use the URL above to go to the specific comment. To unsubscribe, e-mail: commits-unsubscr...@echarts.apache.org For queries about this service, please contact Infrastructure at: us...@infra.apache.org - To unsubscribe, e-mail: commits-unsubscr...@echarts.apache.org For additional commands, e-mail: commits-h...@echarts.apache.org
[GitHub] [echarts] JohnKu2020 commented on issue #5418: series not exists. Legend data should be same with series name or data name
JohnKu2020 commented on issue #5418:
URL: https://github.com/apache/echarts/issues/5418#issuecomment-1383977735

   I have the same problem. Is there correct solution?


--
This is an automated message from the Apache Git Service.
To respond to the message, please log on to GitHub and use the
URL above to go to the specific comment.

To unsubscribe, e-mail: commits-unsubscr...@echarts.apache.org

For queries about this service, please contact Infrastructure at:
us...@infra.apache.org


-
To unsubscribe, e-mail: commits-unsubscr...@echarts.apache.org
For additional commands, e-mail: commits-h...@echarts.apache.org
[GitHub] [echarts] zwygithub opened a new issue, #18178: [Feature] markpoint data zlevel or z
zwygithub opened a new issue, #18178:
URL: https://github.com/apache/echarts/issues/18178

   ### What problem does this feature solve?

   in markpoint data zlevel or z

   ### What does the proposed API look like?

   markpoint data zlevel or z


--
This is an automated message from the Apache Git Service.
To respond to the message, please log on to GitHub and use the
URL above to go to the specific comment.

To unsubscribe, e-mail: commits-unsubscr...@echarts.apache.org.apache.org

For queries about this service, please contact Infrastructure at:
us...@infra.apache.org


-
To unsubscribe, e-mail: commits-unsubscr...@echarts.apache.org
For additional commands, e-mail: commits-h...@echarts.apache.org
[GitHub] [echarts] Ovilia closed issue #18172: [Feature] pie with 2 dimensions
Ovilia closed issue #18172: [Feature] pie with 2 dimensions
URL: https://github.com/apache/echarts/issues/18172


--
This is an automated message from the Apache Git Service.
To respond to the message, please log on to GitHub and use the
URL above to go to the specific comment.

To unsubscribe, e-mail: commits-unsubscr...@echarts.apache.org

For queries about this service, please contact Infrastructure at:
us...@infra.apache.org


-
To unsubscribe, e-mail: commits-unsubscr...@echarts.apache.org
For additional commands, e-mail: commits-h...@echarts.apache.org
[GitHub] [echarts] Ovilia commented on issue #18172: [Feature] pie with 2 dimensions
Ovilia commented on issue #18172:
URL: https://github.com/apache/echarts/issues/18172#issuecomment-1383697790

   If you must have this feature, you can consider fork the repo and make
changes.


--
This is an automated message from the Apache Git Service.
To respond to the message, please log on to GitHub and use the
URL above to go to the specific comment.

To unsubscribe, e-mail: commits-unsubscr...@echarts.apache.org

For queries about this service, please contact Infrastructure at:
us...@infra.apache.org


-
To unsubscribe, e-mail: commits-unsubscr...@echarts.apache.org
For additional commands, e-mail: commits-h...@echarts.apache.org
[GitHub] [echarts] linwrui opened a new issue, #18177: Line graph animation waiting so long cause animationDuration is also working on blank data
linwrui opened a new issue, #18177:
URL: https://github.com/apache/echarts/issues/18177
### Version
5.4.1
### Link to Minimal Reproduction
_No response_
### Steps to Reproduce
You can reproduce at official demo editor with options like
```js
option = {
animationEasing: 'linear',
animationDuration: 8000,
animationDurationUpdate: 0,
xAxis: {
type: 'value',
min: -10,
},
yAxis: {
type: 'value',
axisLine: {
onZero: false,
}
},
series: [
{
connectNulls: true,
data: [218, 135, 147, 260].map((o, index) => [index, o]),
type: 'line'
}
]
};
console.log(option.series)
```
### Current Behavior
As the title says, the line graph animation didn't start immediately, but
waited for a long blank time, which I guess was caused by the animation delay
on the previous blank data
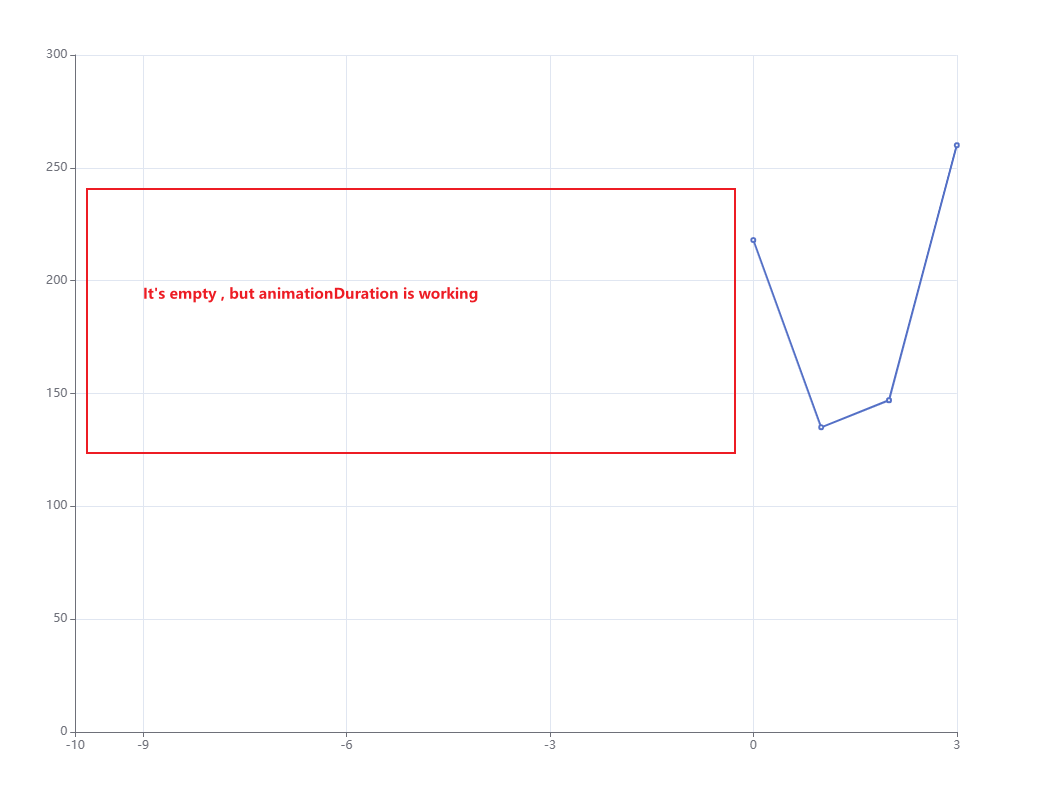
### Expected Behavior
I expected animationDuration will not working on empty data
### Environment
```markdown
- OS:
- Browser:
- Framework:
```
### Any additional comments?
_No response_
--
This is an automated message from the Apache Git Service.
To respond to the message, please log on to GitHub and use the
URL above to go to the specific comment.
To unsubscribe, e-mail: commits-unsubscr...@echarts.apache.org.apache.org
For queries about this service, please contact Infrastructure at:
us...@infra.apache.org
-
To unsubscribe, e-mail: commits-unsubscr...@echarts.apache.org
For additional commands, e-mail: commits-h...@echarts.apache.org
[GitHub] [echarts] slindersAmsterdam commented on issue #18172: [Feature] pie with 2 dimensions
slindersAmsterdam commented on issue #18172:
URL: https://github.com/apache/echarts/issues/18172#issuecomment-1383685633

   I have very smart users who can handle some extra information. :) . If it's
not possible in Echarts to handle two dimensions on a pie chart (angle and
radius) then I have to settle with that.


--
This is an automated message from the Apache Git Service.
To respond to the message, please log on to GitHub and use the
URL above to go to the specific comment.

To unsubscribe, e-mail: commits-unsubscr...@echarts.apache.org

For queries about this service, please contact Infrastructure at:
us...@infra.apache.org


-
To unsubscribe, e-mail: commits-unsubscr...@echarts.apache.org
For additional commands, e-mail: commits-h...@echarts.apache.org
[GitHub] [echarts] sclydon commented on issue #13759: Ability to scroll the piecewise visual map similar to legend
sclydon commented on issue #13759:
URL: https://github.com/apache/echarts/issues/13759#issuecomment-1383676852

   I need this feature as well.


--
This is an automated message from the Apache Git Service.
To respond to the message, please log on to GitHub and use the
URL above to go to the specific comment.

To unsubscribe, e-mail: commits-unsubscr...@echarts.apache.org

For queries about this service, please contact Infrastructure at:
us...@infra.apache.org


-
To unsubscribe, e-mail: commits-unsubscr...@echarts.apache.org
For additional commands, e-mail: commits-h...@echarts.apache.org
[GitHub] [echarts] zqq-7 commented on issue #14973: convertToPixel Function not supported "geo3D".return undefined
zqq-7 commented on issue #14973:
URL: https://github.com/apache/echarts/issues/14973#issuecomment-1383639079

   May I ask how it was finally resolved?


--
This is an automated message from the Apache Git Service.
To respond to the message, please log on to GitHub and use the
URL above to go to the specific comment.

To unsubscribe, e-mail: commits-unsubscr...@echarts.apache.org

For queries about this service, please contact Infrastructure at:
us...@infra.apache.org


-
To unsubscribe, e-mail: commits-unsubscr...@echarts.apache.org
For additional commands, e-mail: commits-h...@echarts.apache.org