[GitHub] storm issue #2203: STORM-2153: New Metrics Reporting API
Github user zodvik commented on the issue:

https://github.com/apache/storm/pull/2203

Was the concern about "My concern here is that most of what we are truly
encoding in the name is metadata" addressed?

Is the expectation that the metric name in dashboards is used like
`storm.topology.{topology ID}.*.*.*.*-myCounter`?


---
[GitHub] storm issue #2203: STORM-2153: New Metrics Reporting API
Github user HeartSaVioR commented on the issue:

https://github.com/apache/storm/pull/2203

@ptgoetz
OK great. I filed an issue for documentation:
https://issues.apache.org/jira/browse/STORM-2904
Please handle this issue. I think we can merge this now.


---
[GitHub] storm issue #2203: STORM-2153: New Metrics Reporting API
Github user ptgoetz commented on the issue:

https://github.com/apache/storm/pull/2203

@HeartSaVioR Absolutlely! I just want to make sure we are all on board with
the changes.


---
[GitHub] storm issue #2203: STORM-2153: New Metrics Reporting API
Github user HeartSaVioR commented on the issue:

https://github.com/apache/storm/pull/2203

@ptgoetz
Could we have document for this? It's OK you would want to document it
after merging this, but follow-up issue should be blocker for the release.


---
[GitHub] storm issue #2203: STORM-2153: New Metrics Reporting API
Github user roshannaik commented on the issue:

https://github.com/apache/storm/pull/2203

**With Acking, Workers=1**

TVL (rate=500k)| lat | throughput
-- | -- | --
1.x | 88.5ms | 52,913
v2-metrics | 91ms | 58,623


Const->Id->Null  | Throughput | avg lat
-- | -- | --
1.x base | 152.6k | 3.3
v2-metrics | 153.5k | 2.8


- Numbers  look good for v2-metrics. Didnt run numbers for
v2-metrics-no-concurrent-map binary.
- TVL was run with default number of ackers. C-I->N was run with 1 instance
of each spout & bolt & acker.


---
[GitHub] storm issue #2203: STORM-2153: New Metrics Reporting API
Github user roshannaik commented on the issue:

https://github.com/apache/storm/pull/2203

**ACKers=0,  Workers=1**


Const->Id->Null | 1.x | v2-metrics | v2-no-cm
-- | -- | -- | --
elapsed (sec) | Throughput | Throughput | Throughput
60 | 553,881 | 557,223 | 294,525
120 | 644,973 | 741,814 | 391,532
180 | 355,677 | 419,571 | 298,619
240 | 126,078 | 157,305 | 289,647
300 | 79,578 | 85,359 | 317,680
360 | 50,575 | 48,993 | 201,650
420 | 32,841 | 25,075 | 136,033
480 | 17,437 | 13,695 | 56,827
540 | 9,572 | 6,871 | 67,272


TVL (rate=500k) | 1.x | v2-metrics | v2-no-cm
-- | -- | -- | --
elapsed (sec) | throughput | throughput | throughput
31 | 88,941.94 | 74,339.33 | 76,130.32
61 | 261,134.00 | 198,329.68 | 220,800.00
92 | 83,889.68 | 131,720.67 | 128,738.00
122 | 42,874.67 | 55,596.67 | 52,115.33
152 | 25,074.00 | 13,489.33 | 26,921.33
182 | 6,610.67 | -473,302.67 | 6,022.67
212 | 0 | 190,620.67 | -475,712.26
242 | -369,348.67 | 153,038.67 | 128,894.00
272 | 238,574.67 | 118,828.67 | 194,515.33
302 | 116,838.00 | 36,540.00 | 96,574.00
332 | 30,613.33 | 3,562.67 | 75,434.67
362 | 3,744.00 | -497,488.67 | 24,842.67
392 | -450,178.67 | 215,857.33 | 9,878.67
422 | 253,464.67 | 202,255.33 | 5,750.00
452 | 131,784.00 | 53,916.00 | 1,986.67
482 | 25,712.00 | 12,618.00 | -544,343.33
512 | 25,050.67 | 5,380.67 | 189,269.33
542 | 5,532.67 | -489,704.00 | 244,687.74
572 | 492 | 257,200.00 | 34,429.33
602 | -507,870.00 | 193,524.67 | 35,392.67
632 | 205,754.00 | 42,620.67 | 990.67


- In both topos and all binaries we see rapid degradation in  throughput
eventually leading to worker dying and getting restarted. As mentioned before,
this is not a new concern for 1.x but being addressed in Storm 2.0.
- The workers for the v2-no-cm binaries ran a little longer than the others
before dying.


---
[GitHub] storm issue #2203: STORM-2153: New Metrics Reporting API
Github user ptgoetz commented on the issue:

https://github.com/apache/storm/pull/2203

It seems like there is growing consensus that performance is good.

Are there any objections to merging this?


---
[GitHub] storm issue #2203: STORM-2153: New Metrics Reporting API
Github user roshannaik commented on the issue:

https://github.com/apache/storm/pull/2203

Just wanted to unblock things here ... will post summarized numbers from my
runs by tomorrow  here is a very brief summary.

I ran both TVL  and ConstSpoutIdBoltNullBoltTopo (with and without ACKing)
in single worker mode.

**With ACKING**:  The latency and throughput numbers are slightly better
for this patch.

**Without ACKING**: In case of both binaries, the worker dies & restarts
after a few every minutes of running if we let the topo run without any
throttling. (a known issue that will get fixed in STORM-2306 for Storm 2.0) The
numbers taken when the worker is running generally indicate that this patch is
most likely slower wrt the peak throughput.  IMO, For Storm1.x this is not an
issue as at higher throughputs worker is going to keep dying. But for Storm
2.0, once we have STORM-2306, it will be possible to better measure the
throughput and a fix may be necessary.

In short, my runs indicate that things are looking good for this patch wrt
Storm 1.x.  May need to revisit perf for Storm 2.0

As mentioned before, will post summarized numbers later.


---
[GitHub] storm issue #2203: STORM-2153: New Metrics Reporting API
Github user HeartSaVioR commented on the issue:

https://github.com/apache/storm/pull/2203

@arunmahadevan
@roshannaik is going to do some performance tests. We could wait his input
in a day or a bit more.


---
[GitHub] storm issue #2203: STORM-2153: New Metrics Reporting API
Github user arunmahadevan commented on the issue:

https://github.com/apache/storm/pull/2203

+1 again.

@HeartSaVioR , based on the TVL numbers I interpret that the performance
numbers (throughput and latency) are comparable to 1.x branch.  In that case
can we merge this patch? If we find any other issues during RC testing we can
take a call.


---
[GitHub] storm issue #2203: STORM-2153: New Metrics Reporting API
Github user HeartSaVioR commented on the issue:

https://github.com/apache/storm/pull/2203

Again I don't have much time to do perf test with details. I increased rate
to 10 (with max spout 5000) which the all the branches even can't catch up
the rate. I lowered rate to 85000 (with max spout 5000) which looks keeping the
rate. Pasting raw values.

>> 1.2.0 (b8f76af)

1.

uptime | acked | acked/sec | failed | 99% | 99.9% | min | max | mean |
stddev | user | sys | gc | mem
-- | -- | -- | -- | -- | -- | -- | -- | -- | -- | -- | -- | -- | --
31 | 437,240 | 14,104.52 | 0 | 6,048,186,367 | 6,358,564,863 |
1,769,996,288 | 6,715,080,703 | 4,566,189,266.37 | 885,893,684.01 | 162,030 |
5,320 | 0 | 848.94
61 | 2,313,000 | 77,100.00 | 0 | 12,280,922,111 | 12,708,741,119 |
4,894,752,768 | 13,186,891,775 | 8,458,374,872.10 | 1,323,986,260.94 | 303,800
| 15,480 | 32,612 | 1,283.47
91 | 2,357,320 | 78,577.33 | 0 | 17,137,926,143 | 18,119,393,279 |
7,637,827,584 | 18,605,932,543 | 11,163,048,118.57 | 2,259,041,300.64 | 303,190
| 16,620 | 32,479 | 1,266.13
121 | 2,341,220 | 78,040.67 | 0 | 22,179,479,551 | 22,682,796,031 |
9,277,800,448 | 22,984,785,919 | 13,752,645,112.96 | 3,421,493,870.62 | 300,820
| 16,360 | 32,251 | 1,534.90
151 | 2,458,660 | 81,955.33 | 0 | 25,685,917,695 | 26,491,224,063 |
11,333,009,408 | 27,514,634,239 | 16,290,749,165.18 | 4,629,241,671.60 |
301,850 | 17,960 | 32,979 | 1,361.38
181 | 2,707,140 | 90,238.00 | 0 | 24,998,051,839 | 25,635,586,047 |
9,554,624,512 | 26,675,773,439 | 16,656,627,804.48 | 4,532,406,841.16 | 314,300
| 18,370 | 34,126 | 1,326.70
211 | 2,758,320 | 91,944.00 | 0 | 22,833,790,975 | 23,471,325,183 |
6,601,834,496 | 24,729,616,383 | 15,588,408,898.78 | 4,512,253,905.57 | 309,680
| 19,180 | 31,032 | 1,425.91
241 | 2,707,380 | 90,246.00 | 0 | 20,854,079,487 | 22,162,702,335 |
3,615,490,048 | 23,018,340,351 | 13,927,540,232.07 | 4,854,717,857.60 | 308,130
| 19,870 | 29,631 | 1,861.17
271 | 2,728,860 | 90,962.00 | 0 | 22,632,464,383 | 24,008,196,095 |
845,152,256 | 25,216,155,647 | 12,358,302,921.24 | 5,927,445,795.86 | 306,950 |
19,100 | 31,501 | 1,787.01
301 | 2,667,500 | 88,916.67 | 0 | 24,763,170,815 | 26,038,239,231 |
17,498,112 | 27,447,525,375 | 11,183,029,224.17 | 7,159,481,478.40 | 308,470 |
19,980 | 31,305 | 2,342.57


2.

uptime | acked | acked/sec | failed | 99% | 99.9% | min | max | mean |
stddev | user | sys | gc | mem
-- | -- | -- | -- | -- | -- | -- | -- | -- | -- | -- | -- | -- | --
30 | 578,720 | 19,290.67 | 0 | 7,402,946,559 | 7,662,993,407 | 266,469,376
| 8,065,646,591 | 5,158,004,864.46 | 1,074,126,219.89 | 262,310 | 9,350 | 9,773
| 1,602.33
60 | 2,372,600 | 79,086.67 | 0 | 11,668,553,727 | 12,054,429,695 |
4,987,027,456 | 12,423,528,447 | 7,402,521,102.49 | 1,520,006,340.32 | 307,880
| 14,850 | 33,679 | 1,237.30
90 | 2,437,040 | 81,234.67 | 0 | 15,216,934,911 | 15,653,142,527 |
5,872,025,600 | 16,617,832,447 | 9,132,024,518.75 | 2,534,964,885.31 | 308,240
| 15,100 | 35,179 | 754.82
120 | 2,543,240 | 84,774.67 | 0 | 16,475,226,111 | 16,944,988,159 |
5,528,092,672 | 17,800,626,175 | 10,760,658,547.64 | 2,897,544,833.24 | 311,050
| 17,130 | 33,127 | 1,370.09
150 | 2,636,720 | 87,890.67 | 0 | 14,310,965,247 | 14,982,053,887 |
2,990,538,752 | 16,139,681,791 | 9,655,823,414.65 | 3,002,342,820.97 | 311,070
| 18,610 | 32,034 | 1,531.01
180 | 2,752,440 | 91,748.00 | 0 | 14,571,012,095 | 15,997,075,455 |
14,172,160 | 16,995,319,807 | 8,147,697,251.82 | 4,013,817,552.85 | 306,620 |
19,910 | 29,342 | 1,275.41
210 | 2,713,300 | 90,443.33 | 0 | 15,032,385,535 | 16,022,241,279 |
46,727,168 | 18,001,952,767 | 6,401,270,339.36 | 4,479,415,024.72 | 301,180 |
20,950 | 27,750 | 1,848.82
240 | 2,692,920 | 89,764.00 | 0 | 15,820,914,687 | 16,827,547,647 |
32,653,312 | 17,582,522,367 | 4,715,121,892.86 | 5,286,625,289.02 | 303,560 |
21,070 | 27,904 | 1,181.89
271 | 2,726,920 | 87,965.16 | 0 | 14,579,400,703 | 15,619,588,095 |
29,425,664 | 16,668,164,095 | 3,519,416,574.71 | 4,638,221,636.04 | 302,440 |
22,290 | 27,634 | 2,023.50
301 | 2,769,580 | 92,319.33 | 0 | 7,050,625,023 | 7,931,428,863 | 7,737,344
| 8,464,105,471 | 960,653,059.65 | 1,605,263,196.59 | 277,020 | 28,700 | 17,844
| 1,250.71

3.

uptime | acked | acked/sec | failed | 99% | 99.9% | min | max | mean |
stddev | user | sys | gc | mem
-- | -- | -- | -- | -- | -- | -- | -- | -- | -- | -- | -- | -- | --
30 | 541,280 | 18,042.67 | 0 | 5,599,395,839 | 5,922,357,247 | 474,218,496
| 6,257,901,567 | 4,213,619,216.15 | 685,663,910.05 | 157,680 | 5,270 | 0 |
1,275.05
60 | 2,407,560 | 80,252.00 | 0 | 10,225,713,151 | 10,812,915,711 |
3,972,005,888 | 11,307,843,583 | 6,705,396,513.71 | 1,066,545,879.38 | 302,660
| 13,700 | 32,120 | 1,532.04
90 | 2,613,980 | 87,132.67 | 0 | 12,658,409,471 | 13,774,094,335 |
[GitHub] storm issue #2203: STORM-2153: New Metrics Reporting API
Github user roshannaik commented on the issue:

https://github.com/apache/storm/pull/2203

So far it seems only throughput impact has been measured. Impact on latency
(if any) appears to be unknown.


---
[GitHub] storm issue #2203: STORM-2153: New Metrics Reporting API
Github user roshannaik commented on the issue:

https://github.com/apache/storm/pull/2203

Without getting some perf numbers for TVL and ConstSpoutIDBoltNullBoltTopo
with ACK=0 and workers=1 we wont know for sure if there are perf regressions.


---
[GitHub] storm issue #2203: STORM-2153: New Metrics Reporting API
Github user arunmahadevan commented on the issue:

https://github.com/apache/storm/pull/2203

@ptgoetz can you squash the commits and also add some user documentation
for this?


---
[GitHub] storm issue #2203: STORM-2153: New Metrics Reporting API
Github user arunmahadevan commented on the issue:

https://github.com/apache/storm/pull/2203

@ptgoetz @HeartSaVioR , given that @revans2  was ok with the patch and the
performance concerns have been addressed, I suggest we merge this in and start
the RC process for Storm 1.2 release going. Meanwhile if @revans2 has
additional comments, we can address it before the final RC.


---
[GitHub] storm issue #2203: STORM-2153: New Metrics Reporting API
Github user ptgoetz commented on the issue:

https://github.com/apache/storm/pull/2203

@revans2 Are there any additional changes you'd like to see for this? I'd
like to move forward with a 1.2 release as well as start porting this to the
master branch.


---
[GitHub] storm issue #2203: STORM-2153: New Metrics Reporting API
Github user HeartSaVioR commented on the issue:

https://github.com/apache/storm/pull/2203

@revans2 Just to be clear, which branch is used from your performance test:
current or my updated branch? Just be sure that things are OK with current
branch or need to adopt.


---
[GitHub] storm issue #2203: STORM-2153: New Metrics Reporting API
Github user HeartSaVioR commented on the issue:

https://github.com/apache/storm/pull/2203

@ptgoetz
Please review the change in HeartSaVioR/storm@16bfb84 and cherry-pick the
commit when you think it worths. I'd be really appreciated if you could also
spend time to run performance test in your side and share numbers to see we are
happy with the patch. (1.x-branch vs metrics_v2 vs
metrics_v2_experimental_no_concurrentmap)

@revans2
Could you review this again, including performance perspective?


---
[GitHub] storm issue #2203: STORM-2153: New Metrics Reporting API
Github user HeartSaVioR commented on the issue:

https://github.com/apache/storm/pull/2203

I'm trying to optimize more since the number doesn't make me happy.

I've applied pre-populating metrics (like @revans2 suggested) to avoid
using ConcurrentHashMap.

https://github.com/HeartSaVioR/storm/commits/metrics_v2_experimental_no_concurrentmap

This commit
(https://github.com/HeartSaVioR/storm/commit/16bfb84ebab98991fe4a8bd284dae9fe2bfe437d)
 represents the difference between 7947a07.

and performance test result from same environment (the number may
fluctuate, as we know):

> 1.2.0-SNAPSHOT (9fbe283) - NOTE: ran earlier, just copied from above
result

>> 1st

uptime | acked | acked/sec | failed | 99% | 99.9% | min | max | mean |
stddev | user | sys | gc | mem
-- | -- | -- | -- | -- | -- | -- | -- | -- | -- | -- | -- | -- | --
30 | 552,480 | 18,416.00 | 0 | 4,114,612,223 | 4,731,174,911 | 38,928,384 |
5,448,400,895 | 1,954,055,956.00 | 966,653,713.81 | 156,170 | 5,290 | 0 | 686.05
60 | 1,578,480 | 52,616.00 | 0 | 1,695,547,391 | 2,191,523,839 | 6,631,424
| 2,736,783,359 | 144,862,518.23 | 373,282,085.72 | 192,290 | 27,900 | 5,208 |
824.31
91 | 1,505,000 | 48,548.39 | 0 | 36,732,927 | 63,275,007 | 6,549,504 |
92,340,223 | 14,052,122.48 | 5,284,329.78 | 172,290 | 30,260 | 2,240 | 794.81
121 | 1,504,400 | 50,146.67 | 0 | 33,505,279 | 55,902,207 | 6,701,056 |
107,020,287 | 13,687,527.65 | 4,682,294.46 | 169,990 | 30,770 | 2,248 | 818.05
151 | 1,503,640 | 50,121.33 | 0 | 30,801,919 | 42,827,775 | 6,594,560 |
62,357,503 | 13,450,356.75 | 4,049,872.91 | 171,380 | 30,030 | 2,217 | 891.86
181 | 1,504,220 | 50,140.67 | 0 | 31,604,735 | 46,366,719 | 6,414,336 |
72,417,279 | 13,549,466.35 | 4,224,069.48 | 173,460 | 30,120 | 2,214 | 817.73
211 | 1,503,580 | 50,119.33 | 0 | 33,816,575 | 46,858,239 | 6,545,408 |
68,681,727 | 13,536,288.26 | 4,442,740.15 | 169,950 | 30,330 | 2,346 | 759.54
241 | 1,503,360 | 50,112.00 | 0 | 33,947,647 | 46,792,703 | 6,488,064 |
68,812,799 | 13,633,138.42 | 4,510,106.94 | 171,560 | 30,490 | 2,456 | 791.93
271 | 1,052,500 | 35,083.33 | 0 | 28,016,639 | 39,452,671 | 6,586,368 |
58,949,631 | 13,142,065.09 | 3,481,304.94 | 170,870 | 29,260 | 2,113 | 795.18
301 | 1,504,320 | 50,144.00 | 0 | 35,454,975 | 60,129,279 | 6,696,960 |
82,575,359 | 13,781,332.77 | 4,965,559.58 | 171,430 | 30,730 | 2,372 | 826.15

>> 2nd

uptime | acked | acked/sec | failed | 99% | 99.9% | min | max | mean |
stddev | user | sys | gc | mem
-- | -- | -- | -- | -- | -- | -- | -- | -- | -- | -- | -- | -- | --
31 | 547,120 | 17,649.03 | 0 | 4,546,625,535 | 5,049,942,015 | 139,984,896
| 5,536,481,279 | 2,700,418,416.88 | 836,528,892.27 | 157,850 | 4,930 | 0 |
845.24
61 | 1,584,360 | 52,812.00 | 0 | 3,078,619,135 | 3,839,885,311 | 6,590,464
| 4,284,481,535 | 248,409,981.64 | 629,496,874.97 | 195,980 | 27,490 | 5,697 |
874.53
91 | 1,504,680 | 50,156.00 | 0 | 35,258,367 | 53,706,751 | 5,910,528 |
91,488,255 | 13,589,168.15 | 4,802,833.49 | 174,400 | 29,550 | 2,183 | 871.71
121 | 1,503,900 | 50,130.00 | 0 | 32,538,623 | 52,789,247 | 6,533,120 |
100,466,687 | 13,482,307.07 | 4,543,434.30 | 186,560 | 32,360 | 2,524 | 802.76
151 | 1,503,860 | 50,128.67 | 0 | 32,735,231 | 52,854,783 | 5,849,088 |
97,976,319 | 13,396,304.62 | 4,506,368.26 | 188,430 | 31,780 | 2,514 | 785.88
181 | 1,503,340 | 50,111.33 | 0 | 29,802,495 | 41,156,607 | 6,737,920 |
63,209,471 | 13,106,089.43 | 3,755,495.86 | 172,070 | 29,540 | 2,151 | 959.27
211 | 1,503,740 | 50,124.67 | 0 | 33,423,359 | 52,625,407 | 6,549,504 |
85,000,191 | 13,426,039.55 | 4,508,334.58 | 187,360 | 32,380 | 2,525 | 869.87
241 | 1,578,440 | 52,614.67 | 0 | 32,129,023 | 50,102,271 | 6,549,504 |
88,276,991 | 13,265,778.42 | 4,265,565.26 | 172,610 | 29,340 | 2,308 | 928.26
271 | 1,503,060 | 50,102.00 | 0 | 30,457,855 | 45,678,591 | 6,565,888 |
73,662,463 | 13,237,281.21 | 4,002,588.03 | 173,180 | 30,550 | 2,291 | 870.36
301 | 1,541,260 | 51,375.33 | 0 | 30,932,991 | 44,498,943 | 6,569,984 |
67,010,559 | 13,223,793.77 | 4,002,853.30 | 172,220 | 29,830 | 2,302 | 1,032.96

>> 3rd

uptime | acked | acked/sec | failed | 99% | 99.9% | min | max | mean |
stddev | user | sys | gc | mem
-- | -- | -- | -- | -- | -- | -- | -- | -- | -- | -- | -- | -- | --
30 | 548,680 | 18,289.33 | 0 | 4,353,687,551 | 5,096,079,359 | 6,729,728 |
5,742,002,175 | 1,426,311,406.48 | 1,230,114,275.09 | 232,920 | 14,020 | 4,188
| 999.57
60 | 1,586,360 | 52,878.67 | 0 | 49,643,519 | 85,590,015 | 6,541,312 |
142,082,047 | 15,200,355.35 | 7,698,991.41 | 180,110 | 33,300 | 2,347 | 1,068.73
90 | 1,504,920 | 50,164.00 | 0 | 35,487,743 | 54,067,199 | 6,561,792 |
95,354,879 | 13,937,343.35 | 4,915,338.14 | 177,210 | 33,140 | 2,256 | 929.59
120 | 1,504,980 | 50,166.00 | 0 | 34,340,863 | 54,558,719 |
[GitHub] storm issue #2203: STORM-2153: New Metrics Reporting API
Github user HeartSaVioR commented on the issue:

https://github.com/apache/storm/pull/2203

Yes, my report mainly represents that the critical perf issue observed from
Bobby has been resolved, but may still need to try out more if we want to go
with detailed comparison.


---
[GitHub] storm issue #2203: STORM-2153: New Metrics Reporting API
Github user roshannaik commented on the issue:

https://github.com/apache/storm/pull/2203

@ptgoetz,  I suggest measuring the perf impact with ACKers=0 as well (with
workers=1).  Having ACKing enabled or interworker-communication going on hides
many perf issues.

In addition to TVL, it is important to measure perf with other topos like
[ConstSpoutNullBoltTopo](https://github.com/apache/storm/blob/master/examples/storm-perf/src/main/java/org/apache/storm/perf/ConstSpoutNullBoltTopo.java)
 and
[ConstSpoutIdBoltNullBoltTopo.java](https://github.com/apache/storm/blob/master/examples/storm-perf/src/main/java/org/apache/storm/perf/ConstSpoutIdBoltNullBoltTopo.java).


The ConstSpout* topos can expose perf issues that TVL might not... and vice
versa.


---
[GitHub] storm issue #2203: STORM-2153: New Metrics Reporting API
Github user HeartSaVioR commented on the issue:

https://github.com/apache/storm/pull/2203

I'm trying to run the performance test, with Ubuntu 17.10,
4.13.0-25-generic #29-Ubuntu SMP Mon Jan 8 21:14:41 UTC 2018.

I updated latest security patches today, which I guess it may include
patches for Meltdown and Spectre. Maybe the machine will take less effect then
others since the machine's CPU is Ryzen, as far as I follow the discussion on
linux kernel (only for Meltdown... I'm not following the mailing list, but read
relevant thread since it was interesting one.)

Btw, both of builds will run in same environment, hence it shouldn't have
much difference between results of both, I think.


---
[GitHub] storm issue #2203: STORM-2153: New Metrics Reporting API
Github user ptgoetz commented on the issue:

https://github.com/apache/storm/pull/2203

When reporting benchmark results, we should include OS patch level. The
recent wave of patches will likely mess with benchmarks.


---
[GitHub] storm issue #2203: STORM-2153: New Metrics Reporting API
Github user HeartSaVioR commented on the issue:

https://github.com/apache/storm/pull/2203

It would need to have a performance test again but besides that I'm +1 on
the change.


---
[GitHub] storm issue #2203: STORM-2153: New Metrics Reporting API
Github user ptgoetz commented on the issue:

https://github.com/apache/storm/pull/2203

@revans2 Could you take another look when you have a chance?


---
[GitHub] storm issue #2203: STORM-2153: New Metrics Reporting API
Github user ptgoetz commented on the issue:

https://github.com/apache/storm/pull/2203

@revans2 @HeartSaVioR Moved to `StringBuilder` and replaced executorId with
taskId.


---
[GitHub] storm issue #2203: STORM-2153: New Metrics Reporting API
Github user ptgoetz commented on the issue:

https://github.com/apache/storm/pull/2203

@HeartSaVioR @revans2

One obvious optimization worth trying is replacing `String.format()` with a
`StringBuilder`. `String.format()` is cleaner visually, but much slower.

I'll make that change and see where it gets us. I'm open to any additional
ideas as well.


---
[GitHub] storm issue #2203: STORM-2153: New Metrics Reporting API
Github user revans2 commented on the issue:

https://github.com/apache/storm/pull/2203

@HeartSaVioR as far as task ids vs executor ids.  There are different ways
of doing this for each of the two metrics systems.  For the built in zookeeper
stats they are for the range `[start-task-id, end-task-id]`


https://github.com/apache/storm/blob/466a7ad74da27c1250eedf412a487db409e42c19/storm-client/src/storm.thrift#L540

For the current metrics system they are for a single task, not an executor.


https://github.com/apache/storm/blob/466a7ad74da27c1250eedf412a487db409e42c19/storm-client/src/jvm/org/apache/storm/metric/api/IMetricsConsumer.java#L40

So this means that for things like queues that are specific to an executor,
and not a task, the metrics may be odd in that the first task in an executor
would get all of the metrics and the others would get little or nothing.

I agree that we probably want to have them be by component id and not
executor id.  We can put them back together into executors when we query the
data.


---
[GitHub] storm issue #2203: STORM-2153: New Metrics Reporting API
Github user HeartSaVioR commented on the issue:

https://github.com/apache/storm/pull/2203

@revans2 @ptgoetz
Btw, shouldn't we pass task id instead of executor id? You know a executor
has tasks and we are providing metrics from each task, not from executor. Also
the format of executor id is [`start task id` `end task id`] which @revans2
@ptgoetz
Btw, shouldn't we pass task id instead of executor id? You know a executor
has tasks and we are providing metrics from each task, not from executor. Also
the format of executor id is [`start task id` `end task id`] which format also
doesn't make sense.


---
[GitHub] storm issue #2203: STORM-2153: New Metrics Reporting API
Github user HeartSaVioR commented on the issue:

https://github.com/apache/storm/pull/2203

@revans2 @ptgoetz
Looks like string concatenation affects a lot. Maybe we should spend time
to optimize here.

One sketched idea is here: If metric name is deterministic at least without
stream id and the metric type (acked, etc.), we might be able to cache metric
name for each executor so that we can apply stream id and metric type
afterwards. The streamId/metric type to full metric name can be cached to map
in executor too. The issue could be changed to one level Hashmap lookup via
string concatenation for (type+streamId) or two level Hashmap lookup (type ->
streamId) vs String concatenation.

The result of dotToUnderscore is encouraged to be cached instead of doing
it all the time.

Not sure how much it helps, but we could have executor level metric
instance map (cache) instead of completely relying on coda hale REGISTRY if it
helps.

cc. @roshannaik since he is working for optimizations so might have some
techniques to apply.


---
[GitHub] storm issue #2203: STORM-2153: New Metrics Reporting API
Github user revans2 commented on the issue:

https://github.com/apache/storm/pull/2203

I just tried it again with
44cd8ac on 1a03093 and got the same results.  A maximum throughput of about
30,000 sentences per second.


---
[GitHub] storm issue #2203: STORM-2153: New Metrics Reporting API
Github user revans2 commented on the issue:

https://github.com/apache/storm/pull/2203

The changes look good an I am +1 on where they are at now.

I am a little concerned about the performance differences though.  I did a
quick test with 1.x-branch (1a030939094e154a6b6d9d6b7fdf4abafd14d5b6) vs this
(8af4fcac3) on 1.x-branch.

The numbers still do not look good, and I was hoping that others might run
some tests too, just to see if they can reproduce my issues.

For ThroughputVsLatency with topology.max.spout.pending=500 I was able to
to 50,000 sentences/second without much difficulty and could just get away with
60,000.  This was using the default parallelism etc.

```
./bin/storm jar storm-starter-1.2.0-SNAPSHOT.jar
org.apache.storm.starter.ThroughputVsLatency 5 -c
topology.max.spout.pending=500
```

But with the new code it maxes out at about 30,000 sentences per second
with the same settings.  I have run it multiple times to be sure it is not a
fluke.


---
[GitHub] storm issue #2203: STORM-2153: New Metrics Reporting API
Github user srdo commented on the issue:

https://github.com/apache/storm/pull/2203

Sorry about not responding earlier. Thanks for addressing my comments.

I skimmed the comments, and found a question that might have been missed
https://github.com/apache/storm/pull/2203/files#r155645156. It's not that I
think we necessarily have to make a change there, but I'd like to understand
whether we're trying to guard against misconfiguration or something else.

Other than that nit this looks great. +1.

Since it's come up a few times, will documentation go here or in a later PR?


---
[GitHub] storm issue #2203: STORM-2153: New Metrics Reporting API
Github user HeartSaVioR commented on the issue:

https://github.com/apache/storm/pull/2203

@revans2 I'm really sorry to bother you, but given that this is coupled
with releasing Storm 1.2.0, I'd like to ask a favor to handle this issue prior
to others.


---
[GitHub] storm issue #2203: STORM-2153: New Metrics Reporting API
Github user HeartSaVioR commented on the issue:

https://github.com/apache/storm/pull/2203

@revans2 Friendly reminder. I think your confirmation is required to merge
this in, because I guess STORM-2156 is coupled with this patch (and maybe vice
versa).


---
[GitHub] storm issue #2203: STORM-2153: New Metrics Reporting API
Github user ptgoetz commented on the issue:

https://github.com/apache/storm/pull/2203

@srdo Thanks for the review. I think I've addressed your comments in the
latest commit.


---
[GitHub] storm issue #2203: STORM-2153: New Metrics Reporting API
Github user srdo commented on the issue:

https://github.com/apache/storm/pull/2203

I had a couple of comments that weren't addressed. I'm mainly worried about
leaking resources in tests/local mode
https://github.com/apache/storm/pull/2203#discussion_r155637510,
https://github.com/apache/storm/pull/2203#discussion_r155642325.


---
[GitHub] storm issue #2203: STORM-2153: New Metrics Reporting API
Github user arunmahadevan commented on the issue:

https://github.com/apache/storm/pull/2203

Hi @revans2 , do you have any additional comments or are we good to merge
this ?


---
[GitHub] storm issue #2203: STORM-2153: New Metrics Reporting API
Github user ptgoetz commented on the issue:

https://github.com/apache/storm/pull/2203

@arunmahadevan Rebased.


---
[GitHub] storm issue #2203: STORM-2153: New Metrics Reporting API
Github user arunmahadevan commented on the issue:

https://github.com/apache/storm/pull/2203

@ptgoetz , can you rebase ?
@revans2 , can you take a look again so that we can get this in 1.2 ?


---
[GitHub] storm issue #2203: STORM-2153: New Metrics Reporting API
Github user HeartSaVioR commented on the issue:

https://github.com/apache/storm/pull/2203

@ptgoetz OK got it. Maybe we could reconsider if separation of stream ID is
not really needed.
@revans2 Could you take a look at this again?


---
[GitHub] storm issue #2203: STORM-2153: New Metrics Reporting API
Github user ptgoetz commented on the issue:

https://github.com/apache/storm/pull/2203

> Looks like we compose metric name and lookup from REGISTRY every time,
even without executor ID and stream ID. I can see more calculation should be
done after addressing, but not sure how much it affects performance. If we
could also memorize metric name per combination of parameters it might help,
but I'm also not sure how much it will help.

Prior to adding stream ID, we could store the metric as a variable and
reuse it without having to do a lookup on each use. Adding stream ID required
(unless I'm missing something) doing the lookup on every use. There might be
additional optimizations, but because metrics names are composed of several
fields, some level of string concatenation is unavoidable. For example, we
could try to optimize lookups by caching metrics with metric name as the key,
but we would still have to do concatenation to create the lookup key.

I suppose we could create a `MetricName` class to serve as the cache key,
but we'd be trading string concatenation for object creation (unless we name
`MetricName` mutable with `setX` methods).

> Regarding issuing warning on name, +1 on your approach. Looks nice!

Thanks for the feedback. Implemented in latest commit.


---
[GitHub] storm issue #2203: STORM-2153: New Metrics Reporting API
Github user HeartSaVioR commented on the issue:

https://github.com/apache/storm/pull/2203

@ptgoetz
Looks like we compose metric name and lookup from REGISTRY every time, even
without executor ID and stream ID. I can see more calculation should be done
after addressing, but not sure how much it affects performance. If we could
also memorize metric name per combination of parameters it might help, but I'm
also not sure how much it will help.

Regarding issuing warning on name, +1 on your approach. Looks nice!


---
[GitHub] storm issue #2203: STORM-2153: New Metrics Reporting API
Github user ptgoetz commented on the issue:

https://github.com/apache/storm/pull/2203

@revans2 @HeartSaVioR

I added stream id and executor id to the metrics names, and implemented
replacing "." with "_".

One consequence of adding stream id was having to get-or-create metrics on
the fly, as opposed to creating them up-front. That means there will be a
lookup, string concat, and string replacement on each metrics update, which
could affect performance. (Unless I'm missing something obvious, we have to do
it that way because we don't know the stream IDs ahead of time and have to
instantiate metrics as we see them).

As far as issuing warnings when names contain ".", one option would be to
handle the warnings in an `ITopologyValidator` instance. We could have
`DefaultTopologyValidator` log warnings when certain names contain a ".". We
could also provide something along the lines of a `StrictTopologyValidator`
that throws a `InvalidTopologyException` as opposed to just warning. That might
be an easy way to transition from warning to error that also gives users to
turn strict checking on or off.

What do you think about that approach?


---
[GitHub] storm issue #2203: STORM-2153: New Metrics Reporting API
Github user HeartSaVioR commented on the issue:

https://github.com/apache/storm/pull/2203

I'm +1 to restrict names to avoid replacing. One thing to consider is that
when's what we call `later`, and personally I think major version is the safest
version to do the change like this, so 2.0.0 looks like good milestone to
address.

Could we poll how many users are using underscore in one of (component
name, stream name, topology name - also hostname?) to user groups, dev groups
and Twitter official account, and apply smooth migration to only 1.x version if
affected groups are small enough?


---
[GitHub] storm issue #2203: STORM-2153: New Metrics Reporting API
Github user revans2 commented on the issue:

https://github.com/apache/storm/pull/2203

@ptgoetz I think that is a good start.  Not sure if users would be upset
that their bolt B.1 now looks like B_1.  We might have issues though if someone
has both a B.1 bolt and a B_1 bolt.  It might serve them right for doing
something so dumb, but could end up being a really painful situation to try and
clean up.  I would rather have us look into restricting names for bolts,
spouts, and streams.  We could just start out with a warning saying metrics
might be messed up if you violate this, and later it becomes an error.


---
[GitHub] storm issue #2203: STORM-2153: New Metrics Reporting API
Github user ptgoetz commented on the issue:

https://github.com/apache/storm/pull/2203

@revans2 Thanks for clarifying. I have a better understanding of what
you're saying now.

How do you feel about just replacing "." with "_" on all metrics path
components (host name, componentId, etc.)? That would ensure a path could be
reliably split on the "." character.

I'll add stream id and executor id to the path in places where they are
available.


---
[GitHub] storm issue #2203: STORM-2153: New Metrics Reporting API
Github user revans2 commented on the issue:

https://github.com/apache/storm/pull/2203

@ptgoetz for me this is all about the metadata for the metric.

The code we have been working on for storing metrics in a DB that we can
then use for scheduling is getting close to being done.  We have a data
structure like the following. (NOTE still a work in progress)

```
struct WorkerMetric {
  1: required string metricName;
  2: required i64 timestamp;
  3: required double metricValue;
  4: required string componentId;
  5: required string executorId;
  6: required string streamId;
}

struct WorkerMetricList {
  1: list metrics;
}

struct WorkerMetrics {
  1: required string topologyId;
  2: required i32 port;
  3: required string hostname;
  4: required WorkerMetricList metricList;
}
```

Having metadata separated out for topology, host, port, etc allow us to
easily ask questions like how many messages were emitted by all instances of
bolt "B" on streamId "default" for the topology "T".  I assume people using
ganglia or nagios want to do the same thing without having to setup a separate
metric for each bolt/spout/hostname/port combination possible.

Almost every metrics system I have seen supports these kinds of metadata or
tags, but almost none of the metrics APIs I have seen support this (dropwizard
included).  As such we need a way to parse these values out of the metric name
in a reliable way.  Making the name more configurable does not help me in this.
 In fact it makes it much more difficult.

The current proposed format is:
```
String.format("storm.worker.%s.%s.%s.%s-%s", stormId, hostName,
componentId, workerPort, name);
```

It has most of the information we need.  It is missing the stream id and
executor id, which for some internal metrics we really need if we are to
replace the metrics on the UI and reduce the load on zookeeper.

But the issue for me is how do I get the metadata back out in a reliable
way?  topologyid is simple to parse out because there is no '.' character
allowed.  hostName is going to have '.' in it, so I don't know what to do
there.  ComponentId and streamId I think are totally open so again I am in
trouble no matter what I do, and then the name itself we could do some
restrictions on to make it simpler.

All I want is some API that can take a metric name and reliably return to
me the fields that we put into creating the name.


---
[GitHub] storm issue #2203: STORM-2153: New Metrics Reporting API
Github user ptgoetz commented on the issue:

https://github.com/apache/storm/pull/2203

@revans2 (cc @HeartSaVioR ) Regarding metadata, parseable metrics
names/paths, etc. what do you think of the following approach?

In a nutshell, make everything configurable (with sane defaults), something
along the lines:

METRICS_V2_PREFIX (String prepended to all metrics paths, replacing
hard-coded "storm.worker", etc. in current code)
METRICS_V2_PATH_DELIMITER (String/character used to separate metrics path,
replaces hard-coded "." in current code.
METRICS_V2_INVALID_NAME_REGEX (Regex that checks user-supplied metrics
names for disallowed characters. Would be used to prevent users from
inadvertently breaking up a path, for example by putting a "." in a metric name
when that's used as the delimiter.

Does that seem reasonable?


---
[GitHub] storm issue #2203: STORM-2153: New Metrics Reporting API
Github user HeartSaVioR commented on the issue:

https://github.com/apache/storm/pull/2203

In case of missing, we have unaddressed comments in here:

https://github.com/apache/storm/blob/00a382b017c1e29863ac4d9a4449086ef79384e4/storm-core/src/jvm/org/apache/storm/metrics2/StormMetricRegistry.java#L133-L135

and @revans2 had a voice regarding metadata of metrics, which IMHO looks
like non-blocker for the patch, but if it makes sense we need to file a
follow-up issue then.


---
[GitHub] storm issue #2203: STORM-2153: New Metrics Reporting API
Github user HeartSaVioR commented on the issue:

https://github.com/apache/storm/pull/2203

@arunmahadevan
I think there're something not addressed in this PR, and I don't think we
can merge before adding document and having patch for master.

@ptgoetz
Could you revisit this and address remaining comments or file issues if it
can be done with follow-up patches? If you don't think they should be
addressed, could you leave comments so that we can discuss and make decisions?

@revans2
Could you revisit this and sort out remaining things from your side?


---
[GitHub] storm issue #2203: STORM-2153: New Metrics Reporting API
Github user arunmahadevan commented on the issue:

https://github.com/apache/storm/pull/2203

+1, @ptgoetz @HeartSaVioR  , are there any more changes planned in this
patch? If no can we look at merging asap so that it can be included in 1.2.0?


---
[GitHub] storm issue #2203: STORM-2153: New Metrics Reporting API
Github user HeartSaVioR commented on the issue:

https://github.com/apache/storm/pull/2203

@ptgoetz @revans2 Addressed the bug (adding sample rate) which is not
expected to affect the performance.


---
[GitHub] storm issue #2203: STORM-2153: New Metrics Reporting API
Github user ptgoetz commented on the issue:

https://github.com/apache/storm/pull/2203

@HeartSaVioR Agreed/understood. We can squash on merge and cleanup commit
messages.

This is a feature branch. You can commit directly if you want.


---
[GitHub] storm issue #2203: STORM-2153: New Metrics Reporting API
Github user HeartSaVioR commented on the issue:

https://github.com/apache/storm/pull/2203

@revans2
I'm OK to deprecate old metrics API in 2.0 and remove it from 3.0. More
important aspect from me is the following up patches from @abellina.

As I stated earlier, the patch only migrate small parts of existing metrics
to new metrics. In master branch we should migrate all the metrics internally
used in Storm codebase to new metrics (do we want to use deprecated API by
ourselves?) and then built-in metrics will not be compatible with current
metrics transfer mechanism (adding to heartbeat).

I expect the patches from @abellina will address this point. Right?


---
[GitHub] storm issue #2203: STORM-2153: New Metrics Reporting API
Github user HeartSaVioR commented on the issue:

https://github.com/apache/storm/pull/2203

@ptgoetz These changes were only for measurement so that's why I made
commit titles as WIP. You can just squash two commits into one and free to
change author (so that we could squash all the commits into one: I don't like
having `address review comments` in master's commit list).

Btw as someone may notice, I didn't handle multiplying the value
accordingly (based on sample rate) so there's bug on the code. I'll address and
provide a single commit which addresses all my works.


---
[GitHub] storm issue #2203: STORM-2153: New Metrics Reporting API
Github user ptgoetz commented on the issue:

https://github.com/apache/storm/pull/2203

@HeartSaVioR Thanks for the update. I pulled your changes into the
metrics_v2 branch.

@revans2 I'll start working on naming conventions and disallowing certain
delimiter characters. If you have any sample paths/names that illustrate your
thinking that would be helpful.


---
[GitHub] storm issue #2203: STORM-2153: New Metrics Reporting API
Github user revans2 commented on the issue:

https://github.com/apache/storm/pull/2203

The new overhead for metrics_v2_replace_meters_to_counters_with_sampling
looks like it is in an acceptable range for me.  Right about a 1% difference
for latency.  (0.97% to 1.29%) and right about a 1.8% to 1.9% difference for
CPU usage.  It is also good to see that even if we turn off the sub sampling
there is not too much of an increase in the overhead.

I would be +1 for merging this in (from a performance perspective still
need to look at the code in more depth), assuming that we can get similar
results for 2.x and with a plan to have the old API deprecated in 2.x and
completely removed in a 3.x release.

We also need to make sure that we have the naming convention figured out or
some kind of tag support so that we can properly do rollups for different types
of metrics.


---
[GitHub] storm issue #2203: STORM-2153: New Metrics Reporting API
Github user HeartSaVioR commented on the issue:

https://github.com/apache/storm/pull/2203

The difference on CPU usage and latency is reduced again, which looks like
closer.
(We need to be aware that test results from same branch fluctuate a bit.)


---
[GitHub] storm issue #2203: STORM-2153: New Metrics Reporting API
Github user HeartSaVioR commented on the issue:

https://github.com/apache/storm/pull/2203

I created another branch for sampling:

https://github.com/HeartSaVioR/storm/tree/metrics_v2_replace_meters_to_counters_with_sampling

> metrics_v2_replace_meters_to_counters_with_sampling

```
uptime:  211 acked: 1,578,860 acked/sec:  52,628.67 failed:0 99%:
   32,849,919 99.9%:  48,136,191 min:   6,545,408 max:  81,461,247
mean:   13,719,507.76 stddev:4,401,893.83 user:174,310 sys: 34,720
gc:  2,159 mem: 777.26
uptime:  241 acked: 1,541,220 acked/sec:  51,374.00 failed:0 99%:
   34,078,719 99.9%:  79,495,167 min:   5,988,352 max: 142,737,407
mean:   13,692,679.51 stddev:5,447,765.36 user:175,140 sys: 33,960
gc:  2,189 mem: 864.25
uptime:  271 acked: 1,503,360 acked/sec:  50,112.00 failed:0 99%:
   31,670,271 99.9%:  50,724,863 min:   6,541,312 max:  86,638,591
mean:   13,532,495.54 stddev:4,225,220.91 user:175,360 sys: 34,390
gc:  2,060 mem: 751.39
```

```
uptime:  211 acked: 1,503,880 acked/sec:  50,129.33 failed:0 99%:
   36,241,407 99.9%:  46,759,935 min:   6,434,816 max:  72,155,135
mean:   14,540,674.05 stddev:5,200,081.08 user:174,870 sys: 35,740
gc:  2,523 mem: 846.15
uptime:  241 acked: 1,503,400 acked/sec:  50,113.33 failed:0 99%:
   41,746,431 99.9%:  68,288,511 min:   6,590,464 max: 137,232,383
mean:   14,784,902.94 stddev:6,220,659.93 user:173,800 sys: 36,400
gc:  2,593 mem: 896.85
uptime:  271 acked: 1,504,120 acked/sec:  50,137.33 failed:0 99%:
   35,880,959 99.9%:  49,971,199 min:   6,553,600 max:  77,070,335
mean:   14,223,920.20 stddev:4,932,482.39 user:175,290 sys: 35,930
gc:  2,380 mem: 886.29
```

```
uptime:  210 acked: 1,616,860 acked/sec:  53,895.33 failed:0 99%:
   32,767,999 99.9%:  48,955,391 min:   6,643,712 max:  73,727,999
mean:   13,798,011.67 stddev:4,442,751.14 user:176,310 sys: 34,800
gc:  2,450 mem: 932.71
uptime:  240 acked: 1,503,640 acked/sec:  50,121.33 failed:0 99%:
   34,897,919 99.9%:  53,379,071 min:   6,475,776 max:  75,366,399
mean:   14,001,232.82 stddev:4,850,826.78 user:176,380 sys: 34,880
gc:  2,568 mem: 921.85
uptime:  270 acked: 1,503,340 acked/sec:  50,111.33 failed:0 99%:
   33,406,975 99.9%:  45,711,359 min:   6,610,944 max:  65,765,375
mean:   14,058,020.45 stddev:4,589,290.14 user:177,140 sys: 35,920
gc:  2,586 mem: 989.75
```

> 1.2.0-SNAPSHOT

```
uptime:  210 acked: 1,503,120 acked/sec:  50,104.00 failed:0 99%:
   36,012,031 99.9%:  54,329,343 min:   6,586,368 max:  86,179,839
mean:   13,866,565.45 stddev:4,940,470.24 user:175,790 sys: 32,220
gc:  2,463 mem: 848.33
uptime:  240 acked: 1,503,520 acked/sec:  50,117.33 failed:0 99%:
   32,571,391 99.9%:  48,988,159 min:   6,623,232 max:  74,448,895
mean:   13,639,588.48 stddev:4,414,394.82 user:173,890 sys: 32,870
gc:  2,435 mem: 929.12
uptime:  270 acked: 1,503,320 acked/sec:  50,110.67 failed:0 99%:
   30,834,687 99.9%:  43,778,047 min:   6,488,064 max:  64,520,191
mean:   13,545,641.23 stddev:4,120,231.64 user:176,190 sys: 32,110
gc:  2,409 mem: 904.40
```

```
uptime:  210 acked: 1,503,540 acked/sec:  50,118.00 failed:0 99%:
   37,421,055 99.9%:  61,341,695 min:   6,582,272 max:  85,393,407
mean:   14,000,161.69 stddev:5,317,874.33 user:172,530 sys: 33,640
gc:  2,455 mem:   1,001.10
uptime:  241 acked: 1,541,460 acked/sec:  49,724.52 failed:0 99%:
   39,157,759 99.9%:  61,603,839 min:   6,426,624 max: 101,056,511
mean:   14,153,442.96 stddev:5,630,083.75 user:173,010 sys: 33,280
gc:  2,617 mem:   1,092.48
uptime:  271 acked: 1,578,560 acked/sec:  52,618.67 failed:0 99%:
   39,780,351 99.9%:  70,909,951 min:   5,787,648 max: 119,734,271
mean:   14,350,305.70 stddev:5,916,972.37 user:174,360 sys: 32,960
gc:  2,569 mem:   1,057.77
```

```
uptime:  210 acked: 1,541,480 acked/sec:  51,382.67 failed:0 99%:
   32,309,247 99.9%:  46,628,863 min:   6,500,352 max:  79,888,383
mean:   13,589,491.43 stddev:4,288,111.92 user:171,970 sys: 33,360
gc:  2,253 mem: 716.99
uptime:  241 acked: 1,540,900 acked/sec:  49,706.45 failed:0 99%:
   34,701,311 99.9%:  52,396,031 min:   6,639,616 max:  92,602,367
mean:   13,937,783.46 stddev:
[GitHub] storm issue #2203: STORM-2153: New Metrics Reporting API
Github user revans2 commented on the issue:

https://github.com/apache/storm/pull/2203

I did a quick analysis of the latency vs CPU usage for the branch from
@HeartSaVioR and this branch based off of the test results posted by
@HeartSaVioR (just to get more of an apples to apples comparison, but my test
results look similar).

It looks like metrics_v2_replace_meters_to_counters had an increased
latency over 1.2.0-SNAPSHOT by about 2.1% to 4.0% (depending on if I do a mean
vs a median of the reported mean latency values)  Similarly for CPU usage it
was between 1.7% to 3.8% more CPU usage.

When using the normal metrics v2 it was a 7.2% to 8.0% increase in latency
and 7.0% to 10.1% increase in CPU.  So this is a huge step in the right
direction.

I really would love to see an overhead of < 1%, but I could probably live
with these numbers.

Would it be possible to try an experiment where we also do random
sub-sampling with these metrics?  I know it is a giant confusion for people to
not have an exact number for metrics, but I would be curious to see what
difference if any it would make so we know what the issue is.


---
[GitHub] storm issue #2203: STORM-2153: New Metrics Reporting API
Github user HeartSaVioR commented on the issue:

https://github.com/apache/storm/pull/2203

So the difference on CPU usage and latency is reduced, whereas there's
still gap between twos. That's what we can imagine, so please do some
performance tests and see the gaps, and discuss whether the gap is tolerable.


---
[GitHub] storm issue #2203: STORM-2153: New Metrics Reporting API
Github user HeartSaVioR commented on the issue:

https://github.com/apache/storm/pull/2203

> metrics_v2_replace_meters_to_counters

```
uptime:  210 acked: 1,504,280 acked/sec:  50,142.67 failed:0 99%:
   35,192,831 99.9%:  52,658,175 min:   6,561,792 max:  97,648,639
mean:   14,233,952.18 stddev:4,975,946.97 user:192,210 sys: 36,820
gc:  2,604 mem: 811.39
uptime:  240 acked: 1,503,860 acked/sec:  50,128.67 failed:0 99%:
   53,510,143 99.9%:  88,276,991 min:   6,643,712 max: 128,581,631
mean:   15,472,482.77 stddev:8,210,141.23 user:178,240 sys: 34,680
gc:  2,605 mem: 889.04
uptime:  271 acked: 1,578,380 acked/sec:  50,915.48 failed:0 99%:
   38,436,863 99.9%:  57,049,087 min:   6,717,440 max:  92,274,687
mean:   14,373,815.12 stddev:5,487,140.26 user:196,260 sys: 37,490
gc:  2,780 mem: 916.19
```

```
uptime:  210 acked: 1,541,100 acked/sec:  51,370.00 failed:0 99%:
   37,486,591 99.9%:  57,409,535 min:   6,664,192 max:  75,169,791
mean:   14,192,844.52 stddev:5,369,622.19 user:179,110 sys: 33,210
gc:  2,571 mem: 677.76
uptime:  240 acked: 1,541,240 acked/sec:  51,374.67 failed:0 99%:
   38,404,095 99.9%:  56,819,711 min:   6,651,904 max:  85,590,015
mean:   14,508,982.42 stddev:5,551,974.72 user:178,550 sys: 34,130
gc:  2,614 mem: 740.89
uptime:  270 acked: 1,503,300 acked/sec:  50,110.00 failed:0 99%:
   37,093,375 99.9%:  59,506,687 min:   6,537,216 max:  92,078,079
mean:   14,124,510.04 stddev:5,286,365.69 user:177,730 sys: 33,530
gc:  2,698 mem: 755.77
```

```
uptime:  211 acked: 1,503,700 acked/sec:  50,123.33 failed:0 99%:
   32,571,391 99.9%:  49,938,431 min:   6,483,968 max:  81,592,319
mean:   13,690,758.91 stddev:4,494,703.26 user:176,600 sys: 34,130
gc:  2,503 mem: 893.43
uptime:  241 acked: 1,578,620 acked/sec:  52,620.67 failed:0 99%:
   39,649,279 99.9%:  63,143,935 min:   6,541,312 max:  98,631,679
mean:   14,144,096.06 stddev:5,696,236.12 user:177,100 sys: 33,880
gc:  2,671 mem: 889.88
uptime:  271 acked: 1,540,000 acked/sec:  51,333.33 failed:0 99%:
   40,632,319 99.9%:  66,912,255 min:   6,782,976 max: 112,984,063
mean:   14,480,762.35 stddev:6,064,099.29 user:180,220 sys: 33,230
gc:  2,743 mem: 832.76
```

> 1.2.0-SNAPSHOT

```
uptime:  211 acked: 1,503,480 acked/sec:  50,116.00 failed:0 99%:
   35,422,207 99.9%:  52,330,495 min:   6,602,752 max:  88,211,455
mean:   14,071,994.11 stddev:4,935,845.81 user:174,870 sys: 34,440
gc:  2,531 mem: 888.99
uptime:  241 acked: 1,503,540 acked/sec:  50,118.00 failed:0 99%:
   36,208,639 99.9%:  52,527,103 min:   6,619,136 max:  95,617,023
mean:   14,146,908.46 stddev:5,030,666.13 user:176,370 sys: 34,290
gc:  2,500 mem: 961.91
uptime:  271 acked: 1,616,180 acked/sec:  53,872.67 failed:0 99%:
   34,111,487 99.9%:  52,133,887 min:   6,529,024 max:  83,099,647
mean:   14,007,535.10 stddev:4,706,000.17 user:175,580 sys: 33,900
gc:  2,458 mem:   1,039.27
```

```
uptime:  210 acked: 1,578,340 acked/sec:  52,611.33 failed:0 99%:
   34,668,543 99.9%:  51,249,151 min:   6,664,192 max:  82,575,359
mean:   13,965,232.22 stddev:4,855,563.94 user:175,000 sys: 33,820
gc:  2,415 mem: 902.57
uptime:  240 acked: 1,541,200 acked/sec:  51,373.33 failed:0 99%:
   34,144,255 99.9%:  51,478,527 min:   5,931,008 max:  80,150,527
mean:   13,730,336.55 stddev:4,719,024.27 user:175,660 sys: 33,430
gc:  2,403 mem: 825.49
uptime:  270 acked: 1,504,080 acked/sec:  50,136.00 failed:0 99%:
   34,340,863 99.9%:  51,019,775 min:   6,594,560 max:  79,167,487
mean:   13,756,017.32 stddev:4,619,909.40 user:175,510 sys: 34,050
gc:  2,366 mem: 819.57
```

```
uptime:  211 acked: 1,541,080 acked/sec:  51,369.33 failed:0 99%:
   29,130,751 99.9%:  48,037,887 min:   6,631,424 max:  87,162,879
mean:   13,285,878.61 stddev:3,908,718.02 user:172,650 sys: 33,080
gc:  2,203 mem: 949.73
uptime:  241 acked: 1,503,620 acked/sec:  50,120.67 failed:0 99%:
   38,830,079 99.9%:  58,392,575 min:   6,602,752 max:  92,340,223
mean:   13,945,274.39 stddev:5,359,104.05 user:173,580 sys: 32,890
gc:  2,295 mem:   1,078.11
uptime:  271 acked: 1,503,400 acked/sec:  50,113.33 failed:0 99%:
[GitHub] storm issue #2203: STORM-2153: New Metrics Reporting API
Github user HeartSaVioR commented on the issue:

https://github.com/apache/storm/pull/2203

I've tried out replacing meters to counters: here is the branch


https://github.com/HeartSaVioR/storm/tree/metrics_v2_replace_meters_to_counters


---
[GitHub] storm issue #2203: STORM-2153: New Metrics Reporting API
Github user ptgoetz commented on the issue:

https://github.com/apache/storm/pull/2203

Crude test, but illustrates the cost of meters:
(code marks a meter | increments a counter from 0 to `Integer.MAX`)
```
*** METER ***
Time: 126.39
ops/sec: 16,990,930
*** COUNTER ***
Time: 18.221
ops/sec: 117,857,617
```

The obvious path would be to switch critical path metrics to use counters.
But I'd ultimately err on the side of user choice (e.g. let users decide which
to use). That could be made configurable. I can imagine use cases where users
would be willing to take a minor performance hit for more performance metrics
(e.g. "sleepy" topologies). The performance hit could be tolerable in certain
situations.

For the time being, I'll switch some of the metrics to counters, and re-run.


---
[GitHub] storm issue #2203: STORM-2153: New Metrics Reporting API
Github user ptgoetz commented on the issue: https://github.com/apache/storm/pull/2203 @revans2 Thanks for the update. My first instinct is that itâs usage of Meter on the critical path. Adding anything that âdoes somethingâ there is going to add some level of overhead. Iâll do some (micro)benchmarking and experiments to find out. I think there will be a number of mitigation options. ---
[GitHub] storm issue #2203: STORM-2153: New Metrics Reporting API
Github user revans2 commented on the issue:

https://github.com/apache/storm/pull/2203

Also looking at the numbers from @HeartSaVioR.  They also show the CPU
being higher, but not nearly as much as mine do 219 seconds for V2 vs 206
seconds for 1.2.0 or about a 6% difference.

Again I really just want to understand where the extra load is coming from
so we can understand how to mitigate it and/or better reason about what will
happen when there are more metrics being used.


---
[GitHub] storm issue #2203: STORM-2153: New Metrics Reporting API
Github user revans2 commented on the issue:

https://github.com/apache/storm/pull/2203

Here are my numbers, and no I didn't do it headless but I was not doing
anything on the laptop at the time it was running except looking at Activity
Monitor to be sure nothing else was using too much CPU.

The setup is

MacBook Pro (Retina, 15-inch, Mid 2015)
2.8 GHz Intel Core i7
16 GB 1600 MHz DDR3
macOS 10.12.6
java version "1.8.0_121"
Java(TM) SE Runtime Environment (build 1.8.0_121-b13)
Java HotSpot(TM) 64-Bit Server VM (build 25.121-b13, mixed mode)


The versions tested are 1.2.0-SNAPSHOT
(b24f5d87cbcd4faeed651e45a8e673db52469a46)
Metrics V2 (78d3de44cf0705efd199fb64b7ef092e23c3285b) which is
1.2.0-SNAPSHOT + 99bcf68 merged in.

The Numbers:

1.2.0-SNAPSHOT
```
./bin/storm jar
../../../examples/storm-starter/target/storm-starter-1.2.0-SNAPSHOT.jar
org.apache.storm.starter.ThroughputVsLatency 5 1 3 -c
topology.max.spout.pending=500
uptime:   30 acked:   602,660 acked/sec:  20,088.67 failed:0 99%:
  741,343,231 99.9%: 757,596,159 min:   3,639,296 max: 768,081,919
mean:   95,373,435.91 stddev:  191,784,964.85 user: 71,070 sys:  4,565
gc:247 mem: 109.46
uptime:   60 acked: 1,504,480 acked/sec:  50,149.33 failed:0 99%:
   13,320,191 99.9%:  15,794,175 min:   3,467,264 max:  30,490,623
mean:9,679,685.54 stddev:1,394,068.49 user: 72,565 sys:  6,299
gc:728 mem:  43.30
uptime:   90 acked: 1,510,500 acked/sec:  50,350.00 failed:0 99%:
   13,279,231 99.9%:  14,704,639 min:   3,352,576 max:  17,612,799
mean:9,650,125.87 stddev:1,358,879.30 user: 72,788 sys:  6,360
gc:732 mem:  73.51
uptime:  120 acked: 1,503,720 acked/sec:  50,124.00 failed:0 99%:
   13,352,959 99.9%:  14,745,599 min:   3,356,672 max:  16,973,823
mean:9,683,344.13 stddev:1,361,582.42 user: 72,855 sys:  6,239
gc:740 mem: 101.27
uptime:  150 acked: 1,654,820 acked/sec:  55,160.67 failed:0 99%:
   13,369,343 99.9%:  14,811,135 min:   3,473,408 max:  16,736,255
mean:9,695,874.65 stddev:1,363,167.65 user: 72,671 sys:  6,327
gc:741 mem: 127.25
uptime:  180 acked: 1,503,740 acked/sec:  50,124.67 failed:0 99%:
   13,377,535 99.9%:  14,811,135 min:   3,448,832 max:  17,711,103
mean:9,682,345.18 stddev:1,370,041.64 user: 72,848 sys:  6,280
gc:756 mem:  41.83

./bin/storm jar
../../../examples/storm-starter/target/storm-starter-1.2.0-SNAPSHOT.jar
org.apache.storm.starter.ThroughputVsLatency 75000 1 3 -c
topology.max.spout.pending=500
uptime:   30 acked:   882,420 acked/sec:  29,414.00 failed:0 99%:
  746,586,111 99.9%: 763,363,327 min:   3,678,208 max: 768,081,919
mean:  202,478,108.44 stddev:  266,947,569.24 user: 50,763 sys:  2,752
gc:  0 mem:  38.93
uptime:   60 acked: 2,497,720 acked/sec:  83,257.33 failed:0 99%:
  213,123,071 99.9%: 256,245,759 min:   3,672,064 max: 271,581,183
mean:   46,314,967.38 stddev:   51,559,780.69 user:118,361 sys:  7,777
gc:  1,322 mem:  85.28
uptime:   90 acked: 2,260,200 acked/sec:  75,340.00 failed:0 99%:
  129,826,815 99.9%: 152,698,879 min:   3,659,776 max: 160,432,127
mean:   29,179,878.90 stddev:   29,586,943.44 user:110,350 sys:  7,583
gc:  1,323 mem:  30.47
uptime:  120 acked: 2,255,680 acked/sec:  75,189.33 failed:0 99%:
  148,504,575 99.9%: 179,306,495 min:   3,700,736 max: 187,301,887
mean:   16,040,979.89 stddev:   23,589,666.52 user:103,839 sys:  7,031
gc:  1,174 mem:  51.50
uptime:  150 acked: 2,255,180 acked/sec:  75,172.67 failed:0 99%:
   81,002,495 99.9%: 117,309,439 min:   3,571,712 max: 123,994,111
mean:   10,956,757.98 stddev:   11,465,433.32 user:100,497 sys:  6,960
gc:  1,136 mem:  90.77
uptime:  180 acked: 2,256,380 acked/sec:  75,212.67 failed:0 99%:
   35,192,831 99.9%:  49,446,911 min:   3,608,576 max:  55,672,831
mean:9,647,021.99 stddev:4,081,135.34 user:100,516 sys:  6,771
gc:  1,141 mem: 110.73

./bin/storm jar
../../../examples/storm-starter/target/storm-starter-1.2.0-SNAPSHOT.jar
org.apache.storm.starter.ThroughputVsLatency 10 1 3 -c
topology.max.spout.pending=500
uptime:   30 acked: 1,023,620 acked/sec:  34,120.67 failed:0 99%:
1,427,111,935 99.9%:   1,442,840,575 min: 141,033,472 max:   1,448,083,455
mean: 1,205,785,740.36 stddev:  167,013,014.66 user: 56,266 sys:  2,615
gc:  0 mem:  53.83
uptime:   60 acked: 2,820,000
[GitHub] storm issue #2203: STORM-2153: New Metrics Reporting API
Github user HeartSaVioR commented on the issue:

https://github.com/apache/storm/pull/2203

OK. While I understand what you're saying, that's not easy for individual
to get it, cause we individual don't want to afford completely idle machine and
use for only performance test. I have been spining up AWS VM with "dedicated"
option to set up clear env. and install mandatory services, and go ahead.
Unfortunately I used all of my AWS coupons and have to rely on my PC which is
closely idle. ;)

One approach is running performance tests several times, and drop outliers
and take average or just see trends. If the performance of A is always or most
of the times greater/lower than B with enough trials, I'd rather believe the
result. (would 5 times be sufficient?)


---
[GitHub] storm issue #2203: STORM-2153: New Metrics Reporting API
Github user ptgoetz commented on the issue:

https://github.com/apache/storm/pull/2203

@HeartSaVioR I know. ;)

I'm thinking more in terms of hardware profile and what other processes are
running.


---
[GitHub] storm issue #2203: STORM-2153: New Metrics Reporting API
Github user HeartSaVioR commented on the issue:

https://github.com/apache/storm/pull/2203

You can scroll the result to see rightmost side which shows CPU, Memory, GC
as well.


---
[GitHub] storm issue #2203: STORM-2153: New Metrics Reporting API
Github user HeartSaVioR commented on the issue:

https://github.com/apache/storm/pull/2203

Here's my machine spec used for performance test:

java version "1.8.0_144"
Java(TM) SE Runtime Environment (build 1.8.0_144-b01)
Java HotSpot(TM) 64-Bit Server VM (build 25.144-b01, mixed mode)

OS: Ubuntu 17.10
CPU: AMD Ryzen 5 1600 3.2Ghz 6 core (with hyper-thread = 12 logical cores)
RAM: Samsung DDR4 32G 19200
SSD: Samsung 850 Evo

I have another dev. machine and I only use the env. for testing at that
time. It only runs some background processes, but CPU usage was around 1 %
before running the tests all the time.


---
[GitHub] storm issue #2203: STORM-2153: New Metrics Reporting API
Github user ptgoetz commented on the issue:

https://github.com/apache/storm/pull/2203

We really need hardware and environment  information. I'd also argue that
tests should be run headless. I've seen some benchmarks vary greatly on a MBP
depending on what you're doing at the time. Something as mundane as checking
email, etc. can affect benchmark results.

sigar might be an easy target (since it's included) to get some of that
info.


---
[GitHub] storm issue #2203: STORM-2153: New Metrics Reporting API
Github user HeartSaVioR commented on the issue: https://github.com/apache/storm/pull/2203 @ptgoetz @revans2 Hereâs my result on performance test: CLI option: org.apache.storm.starter.ThroughputVsLatency 5 -c topology.max.spout.pending=5000 so that utilizes 4 workers by default. > 1.2.0-SNAPSHOT ``` uptime: 210 acked: 1,503,840 acked/sec: 50,128.00 failed:0 99%: 34,734,079 99.9%: 48,103,423 min: 6,541,312 max: 78,381,055 mean: 13,820,460.15 stddev:4,842,731.32 user:173,260 sys: 31,980 gc: 2,583 mem: 669.23 uptime: 240 acked: 1,503,740 acked/sec: 50,124.67 failed:0 99%: 33,456,127 99.9%: 53,346,303 min: 6,479,872 max: 80,412,671 mean: 13,642,800.22 stddev:4,618,847.37 user:172,510 sys: 31,690 gc: 2,513 mem: 614.37 uptime: 270 acked: 1,503,280 acked/sec: 50,109.33 failed:0 99%: 33,013,759 99.9%: 48,201,727 min: 6,574,080 max: 78,315,519 mean: 13,656,544.79 stddev:4,527,513.03 user:173,000 sys: 31,370 gc: 2,513 mem: 740.95 ``` ``` uptime: 211 acked: 1,503,700 acked/sec: 48,506.45 failed:0 99%: 35,061,759 99.9%: 53,444,607 min: 6,516,736 max: 84,410,367 mean: 14,023,839.49 stddev:4,968,132.86 user:173,490 sys: 33,240 gc: 2,453 mem: 1,042.78 uptime: 241 acked: 1,503,920 acked/sec: 50,130.67 failed:0 99%: 32,882,687 99.9%: 53,968,895 min: 6,574,080 max: 81,133,567 mean: 13,700,645.27 stddev:4,592,749.72 user:173,260 sys: 33,190 gc: 2,465 mem: 1,007.66 uptime: 271 acked: 1,503,260 acked/sec: 50,108.67 failed:0 99%: 33,275,903 99.9%: 56,262,655 min: 6,582,272 max: 81,199,103 mean: 13,710,314.71 stddev:4,676,515.80 user:173,910 sys: 32,430 gc: 2,440 mem: 1,065.66 ``` > Metrics V2 ``` uptime: 211 acked: 1,503,580 acked/sec: 50,119.33 failed:0 99%: 40,861,695 99.9%: 62,783,487 min: 6,496,256 max: 106,692,607 mean: 14,696,942.76 stddev:6,041,492.37 user:187,800 sys: 32,170 gc: 2,646 mem: 779.90 uptime: 241 acked: 1,541,060 acked/sec: 51,368.67 failed:0 99%: 41,779,199 99.9%: 70,778,879 min: 6,639,616 max: 113,115,135 mean: 14,872,133.61 stddev:6,435,291.03 user:219,910 sys: 36,630 gc: 3,115 mem: 875.09 uptime: 271 acked: 1,503,780 acked/sec: 50,126.00 failed:0 99%: 41,189,375 99.9%: 63,733,759 min: 6,529,024 max: 104,267,775 mean: 14,738,586.49 stddev:6,153,017.22 user:188,950 sys: 31,950 gc: 2,815 mem: 891.73 ``` ``` uptime: 210 acked: 1,503,520 acked/sec: 50,117.33 failed:0 99%: 47,120,383 99.9%: 89,391,103 min: 6,520,832 max: 142,999,551 mean: 15,073,527.31 stddev:7,453,484.52 user:186,330 sys: 33,150 gc: 2,808 mem: 1,096.18 uptime: 241 acked: 1,540,960 acked/sec: 49,708.39 failed:0 99%: 36,012,031 99.9%: 51,281,919 min: 6,688,768 max: 74,055,679 mean: 14,267,705.37 stddev:4,971,492.31 user:186,600 sys: 33,710 gc: 2,462 mem: 1,192.20 uptime: 271 acked: 1,541,440 acked/sec: 51,381.33 failed:0 99%: 40,075,263 99.9%: 55,181,311 min: 6,725,632 max: 76,021,759 mean: 14,850,073.94 stddev:5,832,959.05 user:187,380 sys: 32,640 gc: 2,577 mem: 1,036.03 ``` The value of 99% and 99.9% latency seems indicating the performance hit. Below is the values from 99.9% latency: * 1.2.0-SNAPSHOT avg(48, 53, 48) => 49.6 avg(53, 53, 56) => 54 * metrics_v2 avg(62, 70, 63) => 65 avg(89, 51, 55) => 65 We may could do another perspective of test: putting higher rate and see which one reaches the limit first. ---
[GitHub] storm issue #2203: STORM-2153: New Metrics Reporting API
Github user revans2 commented on the issue:

https://github.com/apache/storm/pull/2203

@ptgoetz I think I just ran it with default options on my MBP.  But I will
try and reproduce it again.


---
[GitHub] storm issue #2203: STORM-2153: New Metrics Reporting API
Github user HeartSaVioR commented on the issue: https://github.com/apache/storm/pull/2203 @revans2 I need to recheck which thing (meter or counter) they are using, but JStorm also doesnât sample metrics other than histogram. Unless they did custom optimization, IMHO it should be fast enough for us too. ---
[GitHub] storm issue #2203: STORM-2153: New Metrics Reporting API
Github user revans2 commented on the issue:

https://github.com/apache/storm/pull/2203

@HeartSaVioR I agree that if we cannot find a better way we may not want to
support a smooth transition for the metrics, but that also means that we cannot
put it into 1.x.

But I think the underlying problem is actually in our choice of metric.  We
are using a meter everywhere, and looking at the
[code](https://github.com/dropwizard/metrics/blob/v3.2.5/metrics-core/src/main/java/com/codahale/metrics/Meter.java)
 a meter does not appear that cheap.  If all we want/need is a running count,
and not various rates we might want to look at using a
[Counter](https://github.com/dropwizard/metrics/blob/v3.2.5/metrics-core/src/main/java/com/codahale/metrics/Counter.java)
 instead.


---
[GitHub] storm issue #2203: STORM-2153: New Metrics Reporting API
Github user HeartSaVioR commented on the issue:

https://github.com/apache/storm/pull/2203

This patch adds new types of metrics on top of current metrics, so
performance hit is expected. (20% drop looks like not small indeed.) We may
want to consider not supporting smooth transition because of this.

Even we don't support smooth transition, we may want to comment all the old
metrics and re-run benchmark to measure real performance hit.


---
[GitHub] storm issue #2203: STORM-2153: New Metrics Reporting API
Github user revans2 commented on the issue:

https://github.com/apache/storm/pull/2203

I also want to make sure that we take the performance impact of this patch
into consideration.  With the old metrics system we are sub-sampling the
metrics for performance reasons.  With this patch we are not.  When I run
ThroughputVsLatency, not perfect I know.  With this patch the maximum
throughput I am able to get is about 48,000 sentences per second.  Without this
patch I can do about 60,000 reliably.  This is a 20% drop in maximum
throughput.  Note that all I did was adjust the target throughput and set max
spout pending to 500.


---
[GitHub] storm issue #2203: STORM-2153: New Metrics Reporting API
Github user revans2 commented on the issue:

https://github.com/apache/storm/pull/2203

@ptgoetz I think we can fix most of the issues simply by restricting what
name a metric can have (i.e. no `:` allowed and then we use `:` as a
deliminator).  That will give us a guarantee on being able to parse it.  Once
we can parse it hopefully we can look at updating the other plugins to make
them be able to parse the name and turn it into a smaller name with tags.


---
[GitHub] storm issue #2203: STORM-2153: New Metrics Reporting API
Github user ptgoetz commented on the issue:

https://github.com/apache/storm/pull/2203

@revans2 Added rudimentary sanity check validation for metrics reporters
configs. Because reporter implementations may want to have their own custom
config keys, we can't really cover everything. I think we'll have to settle on
basic sanity checks + reporters documenting the custom configuration fields
they expose.

I'll think more about metrics naming and metadata. Like I said, feedback,
opinions and pull requests against this branch are more than welcome.


---
[GitHub] storm issue #2203: STORM-2153: New Metrics Reporting API
Github user revans2 commented on the issue:

https://github.com/apache/storm/pull/2203

So to parse these pieces of information back out I would need to do
something like remove "storm.topology." from the beginning.

Then everything up to the next "." would be the topology-ID because "." is
not allowed in the name.  I could go even further and parse out the topology
name too.

Now I am kind of in trouble, because I have two different fields that can
be anything on both ends of the name.  So my best bet is to look for something
that looks like `\.(\d+)-` and hope that neither the component name nor the
metric name happens to have used something that matches that pattern.

My concern here is that most of what we are truly encoding in the name is
metadata.  All of the examples that graphite and ganglia show use the name as a
hierarchy to make finding the metric I want simpler, i.e.
'system.memory.memory_allocated', or perhaps subdividing the metrics by
application, 'app1.memory.memory_allocated'.  Metadata like the host name,
port, component, etc, are really supported through tags.  The collectors are
not attempting to pull out the metadata and then turn it back into tags.  So
for example lets start with a simple use case. I want to know how many tuples
component B has emitted.  Currently that would require me to combine N separate
metrics together, one per port.

storm.topology.MYTOPO-1-1000.B.6700-emitted
storm.topology.MYTOPO-1-1000.B.6701-emitted
...
storm.topology.MYTOPO-1-1000.B.N-emitted

and then rewrite if I launch my topology again I now have to rewrite all of
my queries to match.  I personally think everyone would be a lot happier if we
could find a good way to translate these into tags.

Additionally the built in metrics that mostly @abellina, and me a tiny bit,
have been working on wants these to be metadata.  Simply because we cannot
reproduce what is happening on the UI in any other clean way.  I am fine with
us using the metric name to store some of this metadata (sadly drop-wizard
gives us no other option), but we really need to parse it out before sending it
on.  I am not sure how simple that would be, seeing how they already come with
built in reporters which was a lot of what we wanted them for.  If it is not
going to be simple to do, then perhaps dropwizard was the wrong choice for a
metrics library.


---
[GitHub] storm issue #2203: STORM-2153: New Metrics Reporting API
Github user revans2 commented on the issue:

https://github.com/apache/storm/pull/2203

So then perhaps I can summarize what we have right now for the naming.

```"storm.topology.%s.%s.%s-%s", getStormId(), getThisComponentId(),
getThisWorkerPort(), name```

Where `getStormId()` is the topology id which should match
`${name}-${counter}-${time-stamp}` where name matches `^[^/.:\]+$`

`getThisComponentId()` which as far as I can tell has no limits on what the
name can be.

`getThisWorkerPort()` which is just an integer for the port this worker is
listening on (no host name that it is a part of)

and `name` which has no limitations on it either.

Dropwizard (the underlying metrics system) requires that names be unique
within a metrics registry, but places no other limitations except that.


---
[GitHub] storm issue #2203: STORM-2153: New Metrics Reporting API
Github user ptgoetz commented on the issue:

https://github.com/apache/storm/pull/2203

@revans2 I agree with you regarding getting the metrics naming correct. In
fact I think it's one of the most important aspects. I'd like to get as much
input/collaboration from others as possible to make sure we get it right from
the start.


---
[GitHub] storm issue #2203: STORM-2153: New Metrics Reporting API
Github user revans2 commented on the issue:

https://github.com/apache/storm/pull/2203

@danny0405 @abellina actually has a patch to do what you were asking about.
 To push metrics to nimbus by way of the supervisor.  It is obviously based off
of this patch, so a lot of this is waiting for this one to be done before
putting that one up.


---
[GitHub] storm issue #2203: STORM-2153: New Metrics Reporting API
Github user ptgoetz commented on the issue:

https://github.com/apache/storm/pull/2203

@revans2, @HeartSaVioR, @arunmahadevan Addressed review comments.

Also note that this is a feature branch, so it's open to pull requests from
anyone. If there's anything you'd like to see that I haven't addressed (e.g.
adding fields to metrics names) feel free to suggest.

Re: Documentation and port to master: Once this is merged I plan to add
documentation and port to master. I can file a JIRA for those if desired.


---
[GitHub] storm issue #2203: STORM-2153: New Metrics Reporting API
Github user ptgoetz commented on the issue:

https://github.com/apache/storm/pull/2203

@HeartSaVioR

> We need to document how to use new metrics and its reporter, and also
need to have patch for master branch (maybe with removal of metrics V1 public
API).

As I mentioned elsewhere, I want to hold off on porting this to the master
branch until all comments are addressed and this patch is in a mergeable state.
That way we can avoid porting small changes between the two branches.

As far as deprecating/removing the metrics v1 API, I'd hold off until there
is a consensus that this approach is a suitable replacement for most use cases.


---
[GitHub] storm issue #2203: STORM-2153: New Metrics Reporting API
Github user ptgoetz commented on the issue:

https://github.com/apache/storm/pull/2203

@arunmahadevan
> Currently this patch addresses registering custom metrics and sending the
metrics out via reporters and does not send any metrics to nimbus right? Why is
disruptor metrics handled as a part of this?

No, this does not send any metrics to nimbus. Disruptor metrics are
included because many users would like to track those metrics (and they aren't
available via Storm UI/REST).

> There will be one thread per reporter per worker which sends out the
metrics to the destination? Just thinking if it would overwhelm the destination
and would need some local aggregation and have the supervisor report the
metrics.

The idea here was to purposely avoid attempting aggregation, since in some
cases it's impossible (e.g. there's no way to aggregate histograms). Instead,
any aggregation is assumed to take place in the destination system (Grafana,
etc.).


---
[GitHub] storm issue #2203: STORM-2153: New Metrics Reporting API
Github user danny0405 commented on the issue: https://github.com/apache/storm/pull/2203 @HeartSaVioR @revans2 I have read most of the tickets and issues of STORM-2153, there are many discussions about the metrics V2 and the now built-in metrics. But i didn't see any about the heartbeats part. Actually the heartbeats now write too much things[ window stats of tasks together] to zookeeper[ or pacemaker ], and we report it for worker granularity which actually can be pre-aggregated by machine/supervisor. With such heavy implementation, we have serious efficiency reduction when cluster grows to be large, like what i have described in JIRA task: https://issues.apache.org/jira/browse/STORM-2693. So i wanna promote the heartbeats part, which can be done individually apart the metrics V2 thing, this is what i will design the heartbeats to be: 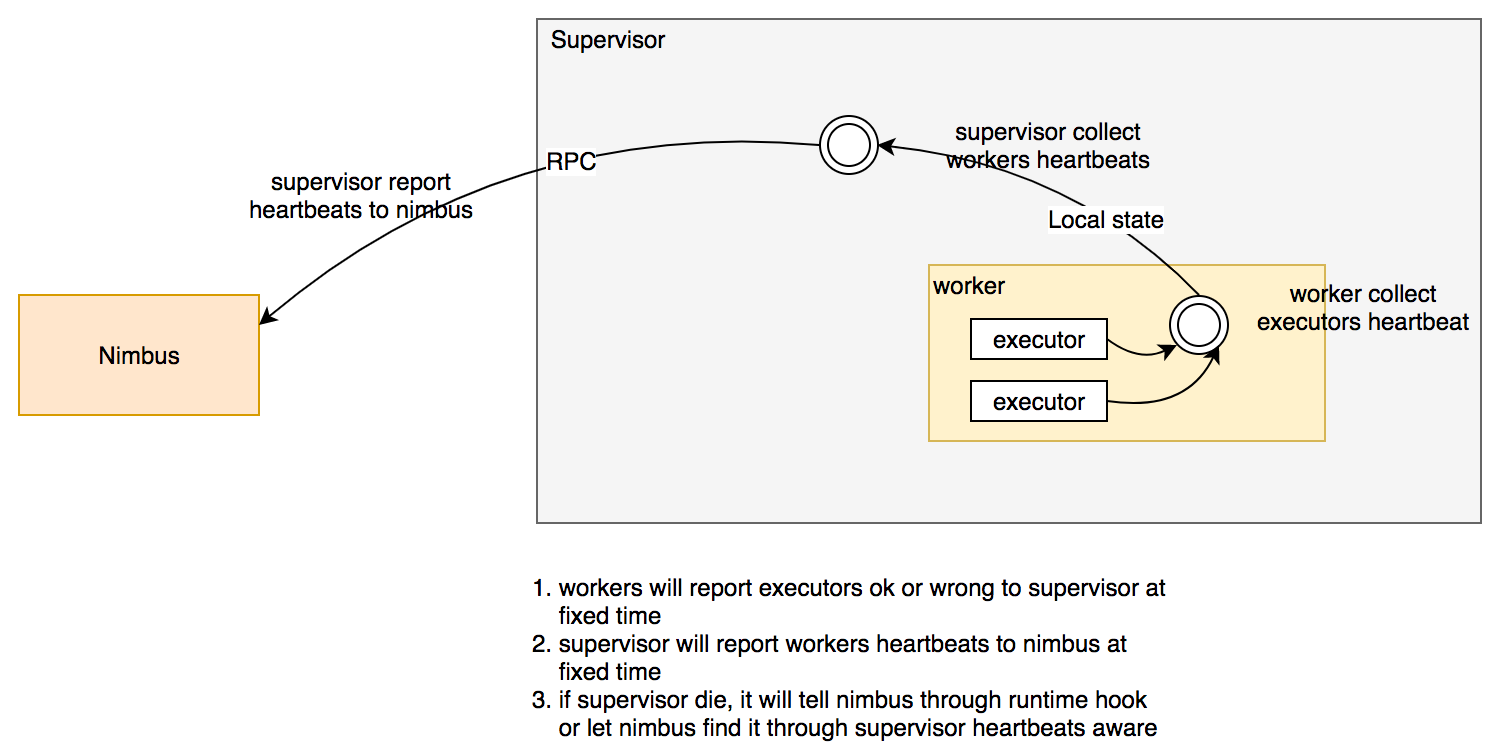 After the promotion, we do not need to read the heartbeats from zookeeper any more when scheduling which will cost much time. But opening Ui will still be slow[ not a big deal anyway ]. ---
[GitHub] storm issue #2203: STORM-2153: New Metrics Reporting API
Github user HeartSaVioR commented on the issue:

https://github.com/apache/storm/pull/2203

In this PR, I see that metrics V2 drops most of built-in metrics.

This PR maintains metrics V1 for built-in and V2 for user-defined and some
of built-in, but in metrics V1 all of built-in metrics are provided to the
metrics consumers, so users will lose some metrics after replacing metrics
consumer to V2. Moreover I guess we would want to replace the old metrics (in
storm internal) eventually.

For worker there's no more task-level metrics, only (worker,
component)-level is available, and it only tracks emit, ack and fail. All
metrics regarding latency are dropped. Netty metrics are dropped too. Some
built-in metrics might not be able to be injected by users, so also need to
consider about this when dropping metrics. Maybe would want to turn on and off
recording part of metrics as Bobby suggested if they impact performance.

All of disruptor queue metrics are taken, but there are many disruptor
queues in worker but metrics are worker-level, and it's gauge (not aggregation)
so one of queue metrics would always overwrite.

So would like to see some explanations that which metrics are selected, how
they're aggregated in worker, how decision has been made, etc.


---
If your project is set up for it, you can reply to this email and have your
reply appear on GitHub as well. If your project does not have this feature
enabled and wishes so, or if the feature is enabled but not working, please
contact infrastructure at infrastruct...@apache.org or file a JIRA ticket
with INFRA.
---
[GitHub] storm issue #2203: STORM-2153: New Metrics Reporting API
Github user HeartSaVioR commented on the issue:

https://github.com/apache/storm/pull/2203

FYI on another news of RocksDB:


https://issues.apache.org/jira/browse/MARMOTTA-669?focusedCommentId=16094738=com.atlassian.jira.plugin.system.issuetabpanels:comment-tabpanel#comment-16094738

```
Hi Sebastian - if you are using ROCKSDB in Marmotta prior to the latest two
versions - where it has been changed to ALv2, then you need to remove it from
your source tree unless it clearly is an "optional dependency" as defined
https://www.apache.org/legal/resolved.html#optional
```

I read this as opposite way: the latest two versions of RocksDB are OK to
be included to the source tree.


---
If your project is set up for it, you can reply to this email and have your
reply appear on GitHub as well. If your project does not have this feature
enabled and wishes so, or if the feature is enabled but not working, please
contact infrastructure at infrastruct...@apache.org or file a JIRA ticket
with INFRA.
---
[GitHub] storm issue #2203: STORM-2153: New Metrics Reporting API
Github user HeartSaVioR commented on the issue:

https://github.com/apache/storm/pull/2203

Just FYI: Facebook just removed PATENT file from RocksDB and make RocksDB
be dual licenses (GPLv2 and Apache).


https://github.com/facebook/rocksdb/commit/3c327ac2d0fd50bbd82fe1f1af5de909dad769e6

Maybe I guess we will be good to go with RocksDB soon.


---
If your project is set up for it, you can reply to this email and have your
reply appear on GitHub as well. If your project does not have this feature
enabled and wishes so, or if the feature is enabled but not working, please
contact infrastructure at infrastruct...@apache.org or file a JIRA ticket
with INFRA.
---
[GitHub] storm issue #2203: STORM-2153: New Metrics Reporting API
Github user ptgoetz commented on the issue:

https://github.com/apache/storm/pull/2203

 > @ptgoetz Suppose we deprecate the built-in metrics, are they deprecated
for public API or also Storm codebase? If we would want latter, we should have
alternative way to collect metrics (maybe internal metrics consumer?) and
represent to the UI.

@HeartSaVioR
I'd definitely deprecate the public API. One approach we could take for
potentially shipping metrics to nimbus would be to implement an additional
reporter that pushes them to some (non-RocksDB ;) ) data store for consumption
by Storm UI.


---
If your project is set up for it, you can reply to this email and have your
reply appear on GitHub as well. If your project does not have this feature
enabled and wishes so, or if the feature is enabled but not working, please
contact infrastructure at infrastruct...@apache.org or file a JIRA ticket
with INFRA.
---
[GitHub] storm issue #2203: STORM-2153: New Metrics Reporting API
Github user HeartSaVioR commented on the issue:

https://github.com/apache/storm/pull/2203

@abellina
Ah no problem. I can see experimental branch from your fork and also pull
request for HBase storage.
Btw, from your status, nimbus is pulling (or some components are pushing,
whatever) the metrics and UI can represent the metrics. Is my understanding
correct?
Does the code (with RocksDB) work in production or in stage? Does it
replace built-in metrics with metrics V2? Or does it also keep built-in metrics
as it as? If it's former, I'd rather see alternatives for RocksDB which can
make default metrics system "out of the box", and adopt that.
In-memory and snapshot (dump to file) approach (no H/A) may also be
acceptable given that requirement for availability of metrics is not too strict.


---
If your project is set up for it, you can reply to this email and have your
reply appear on GitHub as well. If your project does not have this feature
enabled and wishes so, or if the feature is enabled but not working, please
contact infrastructure at infrastruct...@apache.org or file a JIRA ticket
with INFRA.
---
[GitHub] storm issue #2203: STORM-2153: New Metrics Reporting API
Github user abellina commented on the issue:

https://github.com/apache/storm/pull/2203

This certainly is a bummer. I've been focusing on other projects so I have
been out for a while. Sorry about this.

For the status, we have an interface that gets the metrics from codahale to
nimbus and we have a rocksdb implementation. For the default out of the box
metric, we could rocksdb out and populate the maps that nimbus uses for the UI,
at least. Ideally, however, we'd replace rocksdb for another suitable store
(suggestions?)

Along those lines, one of the interns at Oath has code working to use Hbase
as a store. Perhaps that's not the "out of the box" solution, but that is using
the same interface via Nimbus.


---
If your project is set up for it, you can reply to this email and have your
reply appear on GitHub as well. If your project does not have this feature
enabled and wishes so, or if the feature is enabled but not working, please
contact infrastructure at infrastruct...@apache.org or file a JIRA ticket
with INFRA.
---
[GitHub] storm issue #2203: STORM-2153: New Metrics Reporting API
Github user HeartSaVioR commented on the issue:

https://github.com/apache/storm/pull/2203

@ptgoetz Suppose we deprecate the built-in metrics, are they deprecated for
public API or also Storm codebase? If we would want latter, we should have
alternative way to collect metrics (maybe internal metrics consumer?) and
represent to the UI.


---
If your project is set up for it, you can reply to this email and have your
reply appear on GitHub as well. If your project does not have this feature
enabled and wishes so, or if the feature is enabled but not working, please
contact infrastructure at infrastruct...@apache.org or file a JIRA ticket
with INFRA.
---
[GitHub] storm issue #2203: STORM-2153: New Metrics Reporting API
Github user ptgoetz commented on the issue:

https://github.com/apache/storm/pull/2203

@HeartSaVioR

> Do we plan to close all of sub-issues after merging this patch?

No. I'm proposing a alternative. The RocksDb license issue is a blocker, so
I'm proposing we move forward with just t his for now. Ultimately I'd like to
see the built in metrics deprecated.


---
If your project is set up for it, you can reply to this email and have your
reply appear on GitHub as well. If your project does not have this feature
enabled and wishes so, or if the feature is enabled but not working, please
contact infrastructure at infrastruct...@apache.org or file a JIRA ticket
with INFRA.
---
[GitHub] storm issue #2203: STORM-2153: New Metrics Reporting API
Github user HeartSaVioR commented on the issue:

https://github.com/apache/storm/pull/2203

@ptgoetz
OK. Thanks for clarification. Makes sense.

Btw, I still wish that we address issues on built-in metrics and integrate
newer thing to the UI, like what @abellina proposed in JIRA issue.

https://github.com/abellina/storm/blob/new_metrics_diagram/docs/new_metrics_phase_1.png

Do we plan to close all of sub-issues after merging this patch?

ps. I found what you said, RocksDB defining as Category X:
https://issues.apache.org/jira/browse/LEGAL-303 . We've talked about RocksDB as
metrics storage, and someone might consider that also as State storage.
Unfortunate news.


---
If your project is set up for it, you can reply to this email and have your
reply appear on GitHub as well. If your project does not have this feature
enabled and wishes so, or if the feature is enabled but not working, please
contact infrastructure at infrastruct...@apache.org or file a JIRA ticket
with INFRA.
---
[GitHub] storm issue #2203: STORM-2153: New Metrics Reporting API
Github user ptgoetz commented on the issue:

https://github.com/apache/storm/pull/2203

@erikdw Of course! This needs to be documented, and if accepted (or likely
to be), I will do so. But if there's community consensus around NOT accepting
this patch, I'd rather not waste the effort.

This only addresses the sub tasks of STORM-2153 that are marked "in
progress."

The other issues, particularly the RocksDb, is likely off the table for
now, since RocksDb is now considered category x (on a side note, a number of
Apache projects like Kafka and flink are in for some hurt in that respect,
since they will likely have to migrate grate off of RocksDb very shortly).

As far as your other question, aggregation is left to the destination
metrics system. The individual metrics are namespaced with topology, host,
port, etc. that uniquely identify each event down to the component/executor
level. The namespace uses dot (".") notation to make it easy for tools to parse.

You can effectively disable this feature by not registering any reporters.
The metrics objects will still be there, but there will be no reporters doing
anything with them. If would be a fairly simple optimization to only register
the metrics objects if there are one or more reporters registered. (IIRC this
was one for f the concerns you raised in one of the discussion threads...)

@HeartSaVioR

See above for some of your questions.

This is an independent *alternative* to the existing metrics system. The
goal is to make things simpler. I think a lot of users have struggled with
storms built in metrics system, if they have approached it at all.


---
If your project is set up for it, you can reply to this email and have your
reply appear on GitHub as well. If your project does not have this feature
enabled and wishes so, or if the feature is enabled but not working, please
contact infrastructure at infrastruct...@apache.org or file a JIRA ticket
with INFRA.
---
[GitHub] storm issue #2203: STORM-2153: New Metrics Reporting API
Github user HeartSaVioR commented on the issue:

https://github.com/apache/storm/pull/2203

I second @erikdw .

It would be better which part(s) this patch covers in STORM-2153. I can see
various and numerous discussions from STORM-2153, and also various sub-issues.
At a glance, this patch only covers several sub-issues, not exhaustive.

My first thought is, I guess this is not going to be a replacement with
built-in metrics, right? While we have issue on metrics consumer side, but my
observation (concern) was mainly focused to built-in metrics.


---
If your project is set up for it, you can reply to this email and have your
reply appear on GitHub as well. If your project does not have this feature
enabled and wishes so, or if the feature is enabled but not working, please
contact infrastructure at infrastruct...@apache.org or file a JIRA ticket
with INFRA.
---