To get the most from ADEV numbers one needs to be able to get
repeatable and reproducible results.
To get that at short taus the tester needs sub ps resolution.
To get it at long taus, all uncontrolled variable influences that effect the
results (such as temperature) need to be removed and plotted separately.
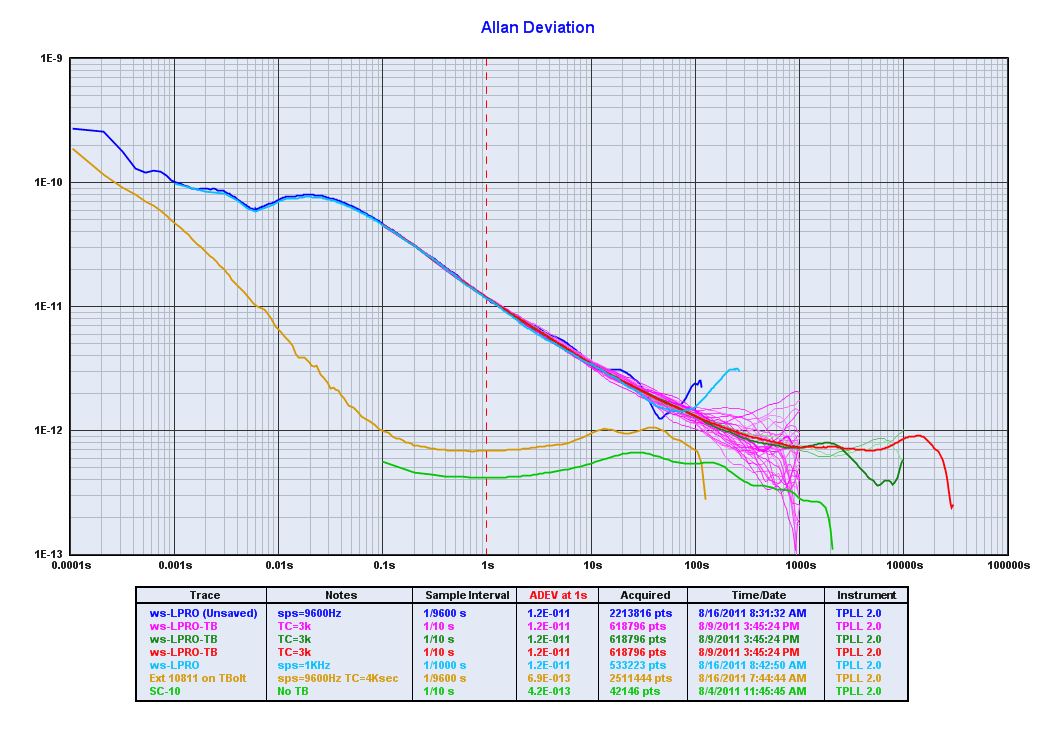
What I've seen is that the LPRO's ADEV turn up at long taus, for the most
part, is caused by either the unit's ageing still settling down or some temp
fluctuations or barometric pressure changes happening during the run.
I've seen that even the natural slow daily temperature cycles can cause an
ADEV turn up at around 1 hr (3000 sec) if the temperature is not controlled
or compensated for or removed with post processing.

I have compared John A's green LPRO ADEV plot taken with a 5120A
and posted at   <http://febo.com/pages/oscillators/rubes/>

with the red & blue LPRO plots I did using a TPLL2.0 posted earlier at
<http://www.febo.com/pipermail/time-nuts/attachments/20111006/46ca3fbc/attachment-0001.gif>

Both LPRO plots are within about 10% of each over the whole range from taus
below 1e-2 to taus above 1e+2
I find this encouraging and somewhat amazing considering they where done on
two completely different systems with different references, at different
times, and different locations, on different LPRO, by different people.

The ADEV difference of about 6 db at 1ms tau can be explained by the fact
that if I apply a 500 Hz LP  filter to my 9600 sps raw data, the same filter
used on the 5120A's  1K sps data, then even our 1ms ADEV answers
become very close.
I have found that using a 1/2 zero tau BW filter like the 5120A does can
falsely lower its tau zero ADEV answer by 3 to 6 dB.
The 5120A's use of a 1/2 tau zero LP cutoff filter is why the 5120A ADEV
answers are generally not the same at Tau zero when sampled at different tau
zero rates.

The difference between our plots at 1k seconds is because the dual oven
HP10811 reference osc I'm using is not as good as the LPRO or John's
HP5065A reference for long term stability.
The ADEV data can not be any better than the Reference Osc used,
but still interesting that the 10K and 20K sec numbers from the my red LPRO
plot nearly match John's green LPRO plot.

Note that the last decade of a ADEV plot can get quite variable as shown in
my test where I'm plotting different sections of the SAME data run.
My green and violet plots show the results of plotting the SAME 60K sec
data run (618K data points) in 3 and 30 segments using one of TimeLabs
useful capabilities.

Can a plot be convincing?
To get the kind of matching seen in John and my plot over the full range
of taus needs everything to be working right.

ws


_______________________________________________
time-nuts mailing list -- [email protected]
To unsubscribe, go to https://www.febo.com/cgi-bin/mailman/listinfo/time-nuts
and follow the instructions there.