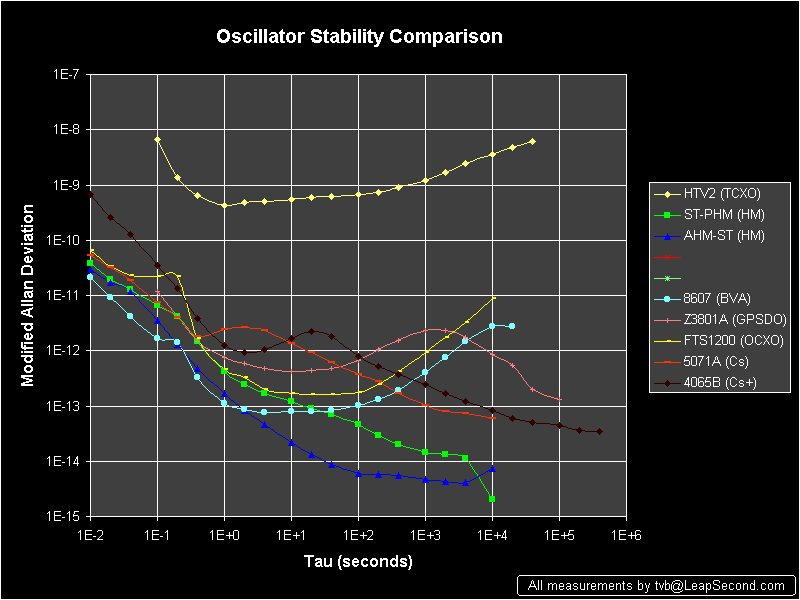
Hello Tom,

Actually no.   Looking at your FTS1200, this is what I thought my plot would
look like.
However you I did not go out to 10-4 secs, only 1 hour 3600 secs
The turnaround in my curve is much faster it happens over only 300 secs.
I will make a few runs at 10-4 and then see how it compares.

Was your sample rate on these 100 per sec?

Thanks Tom


Paul A. Cianciolo
W1VLF
http://www.rescueelectronics.com/
Our business computer network is  powered exclusively by solar and wind
power.
Converting Photons to Electrons for over 20 years


-----Original Message-----
From: [email protected] [mailto:[email protected]] On
Behalf Of Tom Van Baak
Sent: Wednesday, January 29, 2014 1:59 AM
To: Discussion of precise time and frequency measurement
Subject: Re: [time-nuts] TimeLab and the Adev plot

> Whenever I plot an ADEV chart for a given oscillator I see the
> diagonal line descending from upper left to lower right.

Does it look like any of these?
http://leapsecond.com/museum/manyadev.gif

/tvb

_______________________________________________
time-nuts mailing list -- [email protected] To unsubscribe, go to
https://www.febo.com/cgi-bin/mailman/listinfo/time-nuts
and follow the instructions there.

_______________________________________________
time-nuts mailing list -- [email protected]
To unsubscribe, go to https://www.febo.com/cgi-bin/mailman/listinfo/time-nuts
and follow the instructions there.