On Tue, 5 Jan 2016 10:37:08 -0000
"David J Taylor" <[email protected]> wrote:
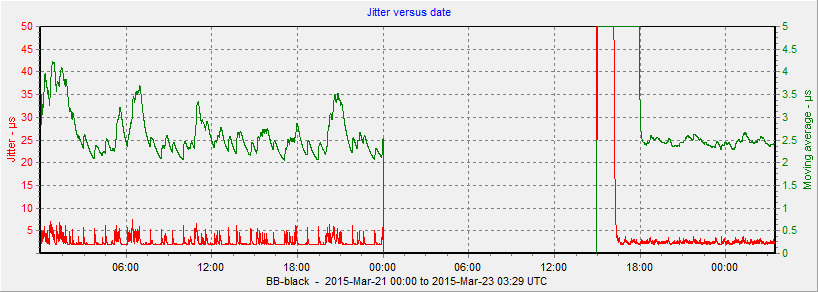
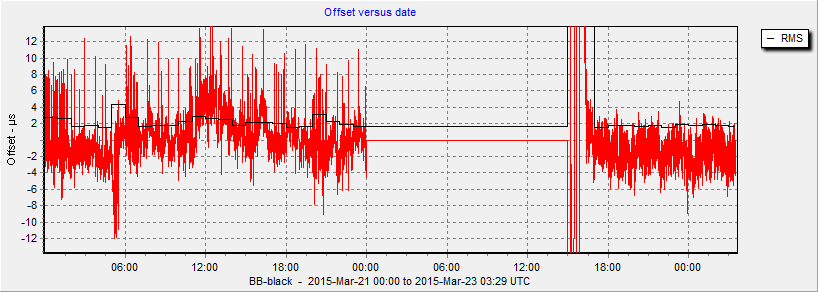
> hanks, Attila.  I'm unsure where you are getting the figures from, but the
> graph shows 2.5 µs averaged jitter:
>
>   http://www.satsignal.eu/ntp/2015-03-21-23-BBB_jitter.png
>
> with the reduced OS, and 2.5 to 4 µs with the fuller OS.  The peak-to-peak
> will higher than those figures, of course.

That's one thing that annoys me with those graphs. If you average jitter
it loses its meaning. What you then get is the mean deviation (aka offset).
Without an accompanying standard deviation (and a test that you actually
have a gausian distribution) this value is not worth much.

What I am talking about is
http://www.satsignal.eu/ntp/2015-03-21-23-BBB_offset.png

The before ("full" OS) and after ("console" OS) is strange by itself.
What kind of process is running that increases interrupt latency jitter
by a factor of 2-3? Why does the "console" OS still exhibit a jitter that
is a factor 2 to 3 higher than what i'd expect as interrupt jitter?


                        Attila Kinali

PS: could you please quote mails properly? It makes them much easier to read.
http://pub.tsn.dk/how-to-quote.php

--
It is upon moral qualities that a society is ultimately founded. All
the prosperity and technological sophistication in the world is of no
use without that foundation.
                 -- Miss Matheson, The Diamond Age, Neil Stephenson
_______________________________________________
time-nuts mailing list -- [email protected]
To unsubscribe, go to https://www.febo.com/cgi-bin/mailman/listinfo/time-nuts
and follow the instructions there.