Hi, all

The subject of position hold mode in GPS receivers pops up every now and
then. Here is a plot that may be of interest to some. Nothing new, but I
thought it a nice visualisation of the difference between position hold and
"not position hold".
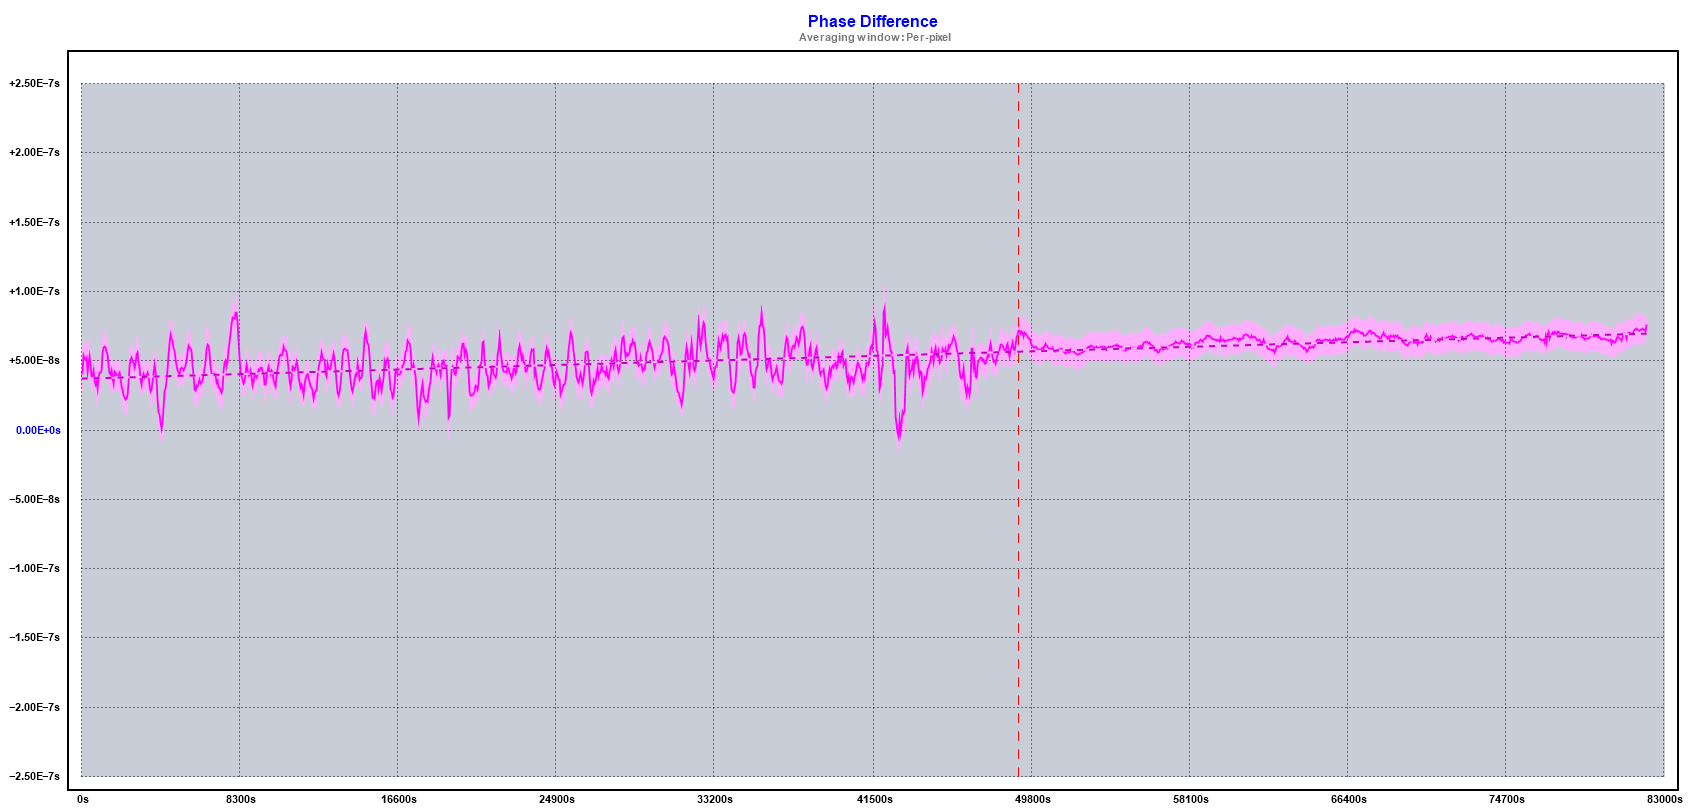
I was measuring EFOS 3 against the PPS of a U-blox LEA-6T to get a coarse
indication of the frequency. I have not got around to mounting permanent
antennas in my new lab, so this was a bare board with a patch-antenna on my
desk - no great precision needed nor expected. I fired up the receiver and
made the measurements while it was still surveying - about half way through
it switched to position hold mode. The position is reported with a standard
deviation of 15 meters, so not a great fix. However, I thought the phase
plot was interesting.

Thinking about a GPSDO, it is easy to see the difference between using the
first half of the plot to discipline an oscillator versus the second half.

In case the attachment does not make it though, it is also here:
http://www.efos3.com/images/AHM%20v%20PPS%20pos%20hold.PNG

Ole
[image: Inline image 1]
_______________________________________________
time-nuts mailing list -- [email protected]
To unsubscribe, go to https://www.febo.com/cgi-bin/mailman/listinfo/time-nuts
and follow the instructions there.