Hi

One minor point:
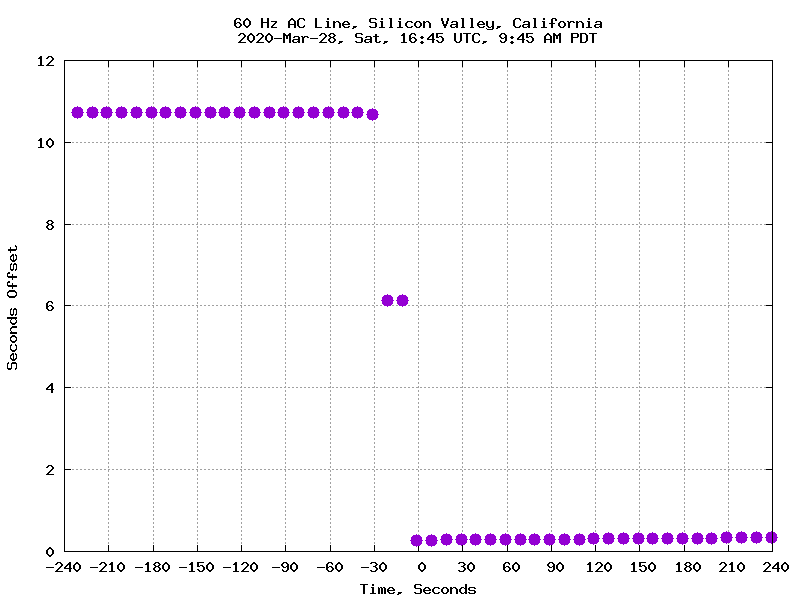
If you *do* decide to digitize the line, think about how much headroom you want
on the digitizer. That applies both in the amplitude and time domains. On a 120V
60 Hz line, is an 800V 300 us pulse of interest? How about a half cycle at 2X
or
(1/4)  line voltage?

If you have a two phase circuit, are both phases of interest? We had a very
similar
hit here Saturday. Based on how things behaved. My guess is that the two phases
didn’t quite do things the same way. It would be nice to have a record …..

Bob

> On Mar 31, 2020, at 8:40 AM, Azelio Boriani <[email protected]> wrote:
>
> It helps to have a digitizer on the line, a 'scope to sample the line,
> say, 20 seconds before and 20 second after a glitch. This way you can
> surely tell what happened without any speculation. There are a number
> of ready made digitizers (red-pitaya, digilent analog discovery, ...)
> if you don't want to use a real time sampling 'scope. Every modern
> microcontroller can also do the job considering the low sampling rate
> needed. Of course a safe analong front-end to interface to the mains
> is needed.
>
> On Tue, Mar 31, 2020 at 7:24 AM Hal Murray <[email protected]> wrote:
>>
>>
>> A while ago, I clean things up so that my system that monitors the line
>> frequency was running off a UPS while watching the non-UPS line.  I looked at
>> some graphs.  It seemed to be working.  I moved on to other things.
>>
>> Last Sat morning, it got tested.  Here is the graph of that area:
>>
>> http://users.megapathdsl.net/~hmurray/time-nuts/60Hz/60Hz-2020-Mar-28.png
>>
>> It's pretty obvious that power was off for 10 seconds, but what are the 2
>> points in the middle?
>>
>> Below is the raw data from around that time.  The second column is
>> seconds-this-day.  The samples are 10 seconds apart, grabbing time and count
>> from the previous cycle.  The 3rd column is the time and the 4th column is
>> the
>> count of cycles since started.  The last column is the number of cycles since
>> the previous sample.  The next to the last column is the time since the last
>> sample.
>>
>> 58936 60238.841  1585413838.824846 184208171   9.998426  600
>> 58936 60248.843  1585413848.839454 184208772  10.014609  601
>> 58936 60258.845  1585413858.837680 184209372   9.998226  600
>> 58936 60268.846  1585413868.835009 184209968   9.997329  596
>> 58936 60278.857  1585413878.849946 184210296  10.014937  328
>> 58936 60288.867  1585413888.865095 184210897  10.015149  601  <==
>> 58936 60298.876  1585413898.862521 184211146   9.997425  249
>> 58936 60308.877  1585413908.876564 184211747  10.014044  601
>> 58936 60318.888  1585413918.873961 184212347   9.997397  600
>> 58936 60328.893  1585413928.888983 184212948  10.015021  601
>>
>> The marked line is a typical sample.  The one after is is only 249 cycles in
>> 10 seconds.  The 2 lines above are both short.
>>
>> I'm pretty sure what happened is that there were two 5 second dropouts 10-15
>> seconds apart.  The first one just barely overlapped the end of a sample
>> period: 596 cycles rather than 599, 600, or 601.  Note that the last dot on
>> the top line is slightly below the rest of the line.
>>
>> The second dot of the middle pair is the marked line.
>>
>>
>> --
>> These are my opinions.  I hate spam.
>>
>>
>>
>>
>> _______________________________________________
>> time-nuts mailing list -- [email protected]
>> To unsubscribe, go to
>> http://lists.febo.com/mailman/listinfo/time-nuts_lists.febo.com
>> and follow the instructions there.
>
> _______________________________________________
> time-nuts mailing list -- [email protected]
> To unsubscribe, go to
> http://lists.febo.com/mailman/listinfo/time-nuts_lists.febo.com
> and follow the instructions there.


_______________________________________________
time-nuts mailing list -- [email protected]
To unsubscribe, go to
http://lists.febo.com/mailman/listinfo/time-nuts_lists.febo.com
and follow the instructions there.