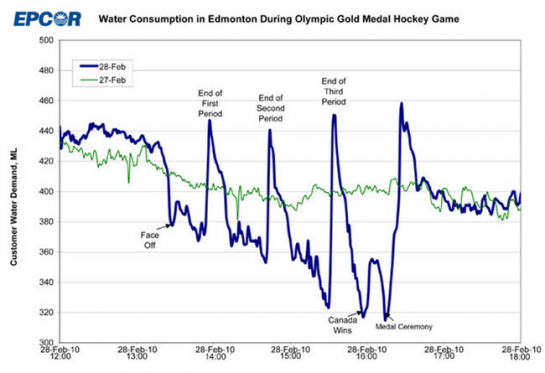
Hi

I saw this a few weeks ago ... great graph!  It has been many years so I cannot
retrieve the appropriate terminology, but data appears to have many properties
of quasi-experimental designs a la Cook & Campbell.  So a number of causal
conclusions appear likely (to varying degrees), including: (1) Edmonton
(Canadian, all, ...?) hockey fans urinate at certain well defined intervals
between periods, and (2) Edmonton (Canadian, all, ...?) hockey fans like to
consume beer while watching hockey (this is the more speculative part of the
model, although not a stretch for anyone familiar with Canadian hockey fans ...
that would be the Bayesian part of the "analysis").
Take care
Jim

James M. Clark
Professor of Psychology
204-786-9757
204-774-4134 Fax
[email protected]

>>> "William Scott" <[email protected]> 01-May-10 7:13:44 PM >>>
I know others have contributed graphics from this source which is highly
recommended and here is another. The relationship between water use in a large
Canadian city and the Canadian Olympic hockey finals. Water use includes
drinking, watering the lawns and plants, washing the cars, and of course,
flushing the toilet. Of course, this is only a correlation between television
sports production and behavior, but what kind of causation inferences are we
going to make?

Bill Scott


http://flowingdata.com/wp-content/uploads/yapb_cache/flush_game.5va6dz765ugw8880gswc80w8o.bxj7bs82axw0g448owg4gc8so.th.png


Bill Scott


---
You are currently subscribed to tips as: [email protected].
To unsubscribe click here:
http://fsulist.frostburg.edu/u?id=13251.645f86b5cec4da0a56ffea7a891720c9&n=T&l=tips&o=2375

or send a blank email to
leave-2375-13251.645f86b5cec4da0a56ffea7a89172...@fsulist.frostburg.edu


---
You are currently subscribed to tips as: [email protected].
To unsubscribe click here:
http://fsulist.frostburg.edu/u?id=13090.68da6e6e5325aa33287ff385b70df5d5&n=T&l=tips&o=2379
or send a blank email to
leave-2379-13090.68da6e6e5325aa33287ff385b70df...@fsulist.frostburg.edu