On Tue, 23 Jun 2009, milosz wrote:
is this a direct write to a zfs filesystem or is it some kind of zvol export?
This is direct write to a zfs filesystem implemented as six mirrors of
15K RPM 300GB drives on a Sun StorageTek 2500. This setup tests very
well under iozone and performs remarkably well when extracting from
large tar files.
anyway, sounds similar to this:

http://opensolaris.org/jive/thread.jspa?threadID=105702&tstart=0
Yes, this does sound very similar. It looks to me like data from read
files is clogging the ARC so that there is no more room for more
writes when ZFS periodically goes to commit unwritten data. The
"Perfmeter" tool shows that almost all disk I/O occurs during a brief
interval of time. The storage array is capable of writing at high
rates, but ZFS is coming at it with huge periodic writes which are
surely much larger than what the array's internal buffering can
handle.
What is clear to me is that my drive array is "loafing". The
application runs much slower than expected and zfs is to blame for
this. Observed write performance could be sustained by a single fast
disk drive. In fact, if I direct the output to a single SAS drive
formatted with UFS, the observed performance is fairly similar except
there are no stalls until iostat reports that the drive is extremely
(close to 99%) busy. When the UFS-formatted drive is reported to be
60% busy (at 48MB/second), application execution is very smooth. If a
similar rate is sent to the ZFS pool (52.9MB/second according to zpool
iostat) and the individual drives in the pool are reported to be 5 to
33% busy (24-31% for 60 second average), then execution stutters for
three seconds at a time as the 1.5GB to 3GB of "written" data which
has been batched up is suddenly written.
Something else interesting I notice is that performance is not
consistent over time:
% zpool iostat Sun_2540 60
                capacity     operations    bandwidth
pool         used  avail   read  write   read  write
----------  -----  -----  -----  -----  -----  -----
Sun_2540     460G  1.18T    368    447  45.7M  52.9M
Sun_2540     463G  1.18T    336    400  42.1M  47.5M
Sun_2540     465G  1.17T    341    400  42.6M  47.2M
Sun_2540     469G  1.17T    280    473  34.8M  55.9M
Sun_2540     472G  1.17T    286    449  35.5M  52.5M
Sun_2540     474G  1.17T    338    391  42.1M  45.7M
Sun_2540     477G  1.16T    332    400  41.3M  47.0M
Sun_2540     479G  1.16T    300    356  37.5M  41.4M
Sun_2540     482G  1.16T    314    381  39.3M  43.8M
Sun_2540     485G  1.15T    520    479  63.0M  55.9M
Sun_2540     490G  1.15T    564    722  67.3M  84.7M
Sun_2540     494G  1.15T    586    539  70.4M  63.1M
Sun_2540     499G  1.14T    549    698  66.9M  81.9M
Sun_2540     504G  1.14T    547    749  65.6M  87.7M
Sun_2540     507G  1.13T    584    495  70.8M  57.8M
Sun_2540     512G  1.13T    544    822  64.9M  91.1M
Sun_2540     516G  1.13T    596    527  72.0M  60.4M
Sun_2540     521G  1.12T    561    759  68.0M  87.2M
Sun_2540     526G  1.12T    548    779  65.9M  88.6M
A 2X variation in minute-to-minute performance while performing
consistently similar operations is remarkable. Also notice that the
write data rates are gradually increasing (on average) even though
the task being performed remains the same.
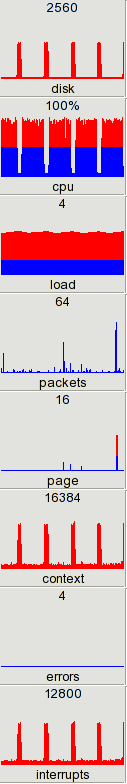
Here is a Perfmeter graph showing what is happening in normal
operation:
http://www.simplesystems.org/users/bfriesen/zfs-discuss/perfmeter-stalls.png
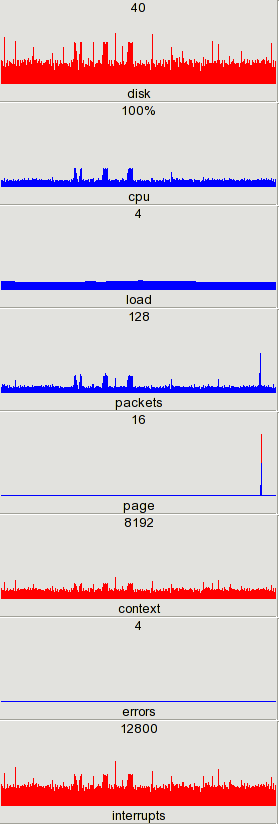
and here is one which shows what happens if fsync() is used to force
the file data entirely to disk immediately after each file has been
written:
http://www.simplesystems.org/users/bfriesen/zfs-discuss/perfmeter-fsync.png

Bob
--
Bob Friesenhahn
bfrie...@simple.dallas.tx.us, http://www.simplesystems.org/users/bfriesen/
GraphicsMagick Maintainer,    http://www.GraphicsMagick.org/
_______________________________________________
zfs-discuss mailing list
zfs-discuss@opensolaris.org
http://mail.opensolaris.org/mailman/listinfo/zfs-discuss