echarts-bot[bot] commented on issue #16487:
URL: https://github.com/apache/echarts/issues/16487#issuecomment-1034555993
@piscesvivian It seems you are not using English, I've helped translate the content automatically. To make your issue understood by more people and get helped, we'd like to suggest using English next time. 🤗 <details><summary><b>TRANSLATED</b></summary><br> **TITLE** [Feature] can support drawing **BODY** ### What problem does this feature solve? In algorithmic data analysis, a graph is often used in the paper. Seaborn has been implemented, but ECharts is not clear how to draw it. Shaped like: 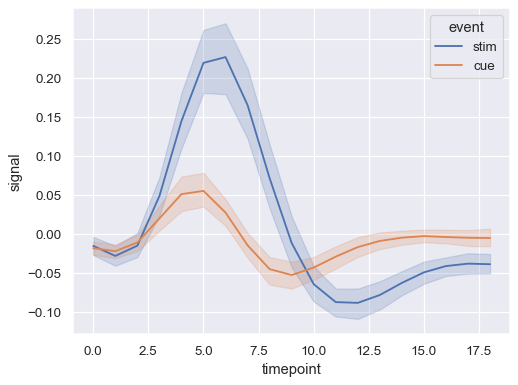 show the mean and 95% confidence interval And can smooth the average line The specific drawing example is shown in the seaborn lineplot document: http://seaborn.pydata.org/generated/seaborn.lineplot.html ### What does the proposed API look like? Can we provide a class: type: lineplot drawing method? </details> -- This is an automated message from the Apache Git Service. To respond to the message, please log on to GitHub and use the URL above to go to the specific comment. To unsubscribe, e-mail: [email protected] For queries about this service, please contact Infrastructure at: [email protected] --------------------------------------------------------------------- To unsubscribe, e-mail: [email protected] For additional commands, e-mail: [email protected]