echarts-bot[bot] commented on issue #16627:
URL: https://github.com/apache/echarts/issues/16627#issuecomment-1058906573
@guchengjie It seems you are not using English, I've helped translate the content automatically. To make your issue understood by more people and get helped, we'd like to suggest using English next time. 🤗 <details><summary><b>TRANSLATED</b></summary><br> **TITLE** [Bug] Echart5.3 line chart setting areastyle gradient LinearGradient error reporting **BODY** ### Version 5.3 ### Link to Minimal Reproduction https://echarts.apache.org/examples/en/editor.html?c=line-simple ### Steps to Reproduce 1.[Open the official website](https://echarts.apache.org/examples/zh/editor.html?c=line-simple) 2. Type `option = { xAxis: { type: 'category', data: ['Mon', 'Tue', 'Wed', 'Thu', 'Fri', 'Sat', 'Sun'] }, yAxis: { type: 'value' }, series: [ { data: [150, 230, 224, 218, 135, 147, 260], type: 'line', areaStyle: { opacity: 0.8, color: new echarts.graphic.LinearGradient(0, 0, 0, 1, [{ offset: 0, color: 'rgb(136, 193, 250, 1)' }, { offset: 1, color: 'rgb(255, 255, 255, 0)' } ]) } } ] };` 3. Open the debugging tool and an error will appear ### Current Behavior An error occurs and is triggered multiple times ### Expected Behavior normal operation ### Environment ````markdown - OS: win10 - Browser:chrome 98 - Framework: react, webpack ```` ### Any additional comments? 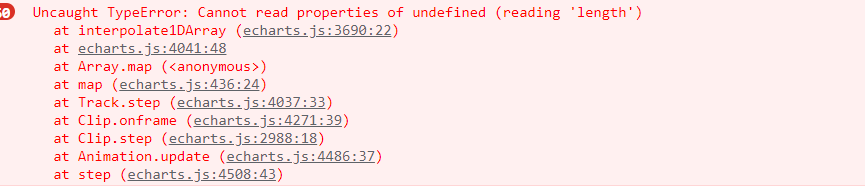 </details> -- This is an automated message from the Apache Git Service. To respond to the message, please log on to GitHub and use the URL above to go to the specific comment. To unsubscribe, e-mail: [email protected] For queries about this service, please contact Infrastructure at: [email protected] --------------------------------------------------------------------- To unsubscribe, e-mail: [email protected] For additional commands, e-mail: [email protected]