[email protected] said:
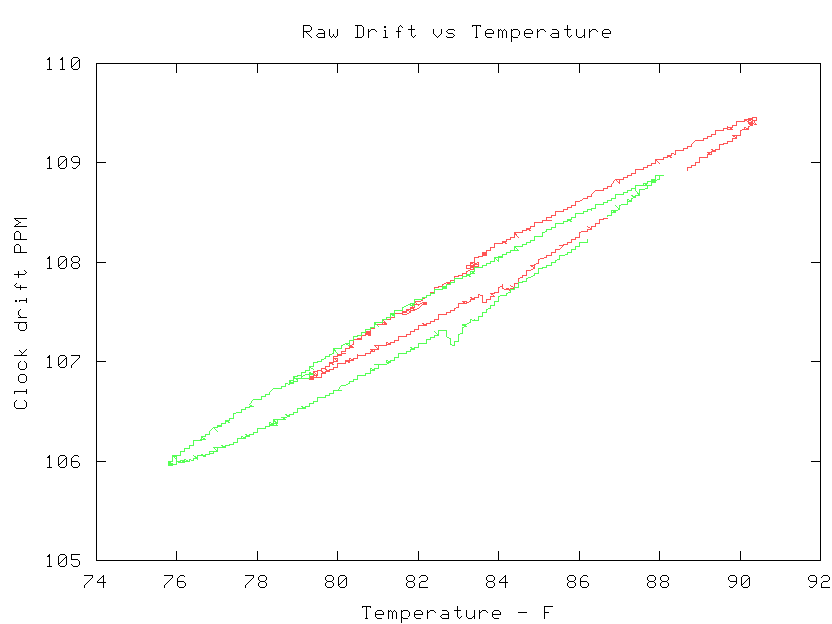
> Ths plot is NTP drift vs. temp.

No, that's a plot of temp vs time and another plot from a different file of
drift vs time.  If you can capture both at the same time then you can ignore
the time in the file and plot drift vs temp.
  http://users.megapathdsl.net/~hmurray/ntp/slope.gif
You can probably do it with some post processing to merge 2 files.  For me,
it was easier to fix the data collection side.


> The data in /etc/driftfile is just the Frequency offset written every hour
> or so.

The "every hour or so" is pretty ugly.

Better to get it from loopstats.  Or from the kernel.  I'll send you python
code if you want it.


--
These are my opinions.  I hate spam.


_______________________________________________
devel mailing list
[email protected]
http://lists.ntpsec.org/mailman/listinfo/devel