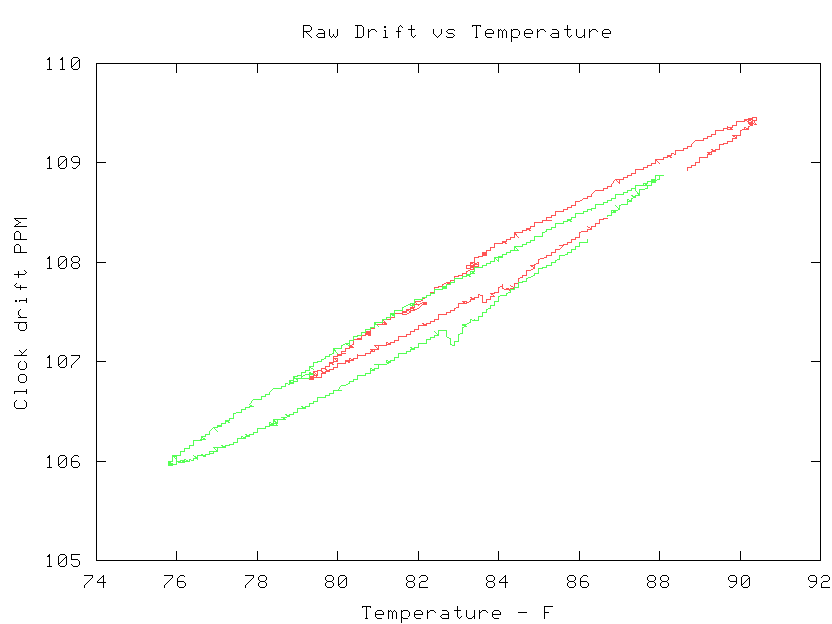
Yo Achim!

On Mon, 09 Jan 2017 20:46:26 +0100
Achim Gratz <[email protected]> wrote:
> Hal Murray writes:
> > [email protected] said:
> >> Ths plot is NTP drift vs. temp.
> >
> > No, that's a plot of temp vs time and another plot from a different
> > file of drift vs time.  If you can capture both at the same time
> > then you can ignore the time in the file and plot drift vs temp.
> >   http://users.megapathdsl.net/~hmurray/ntp/slope.gif
>
> Do you really mean "frequency drift" or rather  "frequency offset"?
> From the values it looks like you meant the NTP loop offset.

Specifially it is field 4 of the loopstats file.  I'm just using the
'standard' NTP terminology.  In NTP land both terms are used for the
same thing.

I'm not gonna fight 20+ years of existing usage, but in ntpviz I only
refer to it as 'Frequency Offset'.  But it is the same thing written
to the driftfile, so it is also the drift.

> > You can probably do it with some post processing to merge 2 files.
> > For me, it was easier to fix the data collection side.
>
> Merging two files actually is easy, provided that the timestamps align
> exactly:
>
> join --nocheck-order -a1 -j1 ppswatch.txt loop.stats > joined.txt

adly they do not align exactly.  gps-log by default logs every 5 seconds
in one file, and ntpd logs to loopstats when it feels like it.  In
practice when I plot with gnuplot the data is oversampled so the
end results looks the same.

RGDS
GARY
---------------------------------------------------------------------------
Gary E. Miller Rellim 109 NW Wilmington Ave., Suite E, Bend, OR 97703
        [email protected]  Tel:+1 541 382 8588

            Veritas liberabit vos. -- Quid est veritas?
    "If you can’t measure it, you can’t improve it." - Lord Kelvin
 pgpZcdyrolzOM.pgp
Description: OpenPGP digital signature
_______________________________________________
devel mailing list
[email protected]
http://lists.ntpsec.org/mailman/listinfo/devel