jpeach commented on PR #9482:
URL: https://github.com/apache/trafficserver/pull/9482#issuecomment-1609104417

   > ### Before (w/o this change)
   > ```
   > $ h2load -n 100000 -m 10 -c 10 -t 5 https://localhost:8443/8k              


   > starting benchmark...                                                      
                                                             
   > spawning thread #0: 2 total client(s). 20000 total requests                
                                                             
   > spawning thread #1: 2 total client(s). 20000 total requests                
                                                             
   > spawning thread #2: 2 total client(s). 20000 total requests                
                                                             
   > spawning thread #3: 2 total client(s). 20000 total requests                
                                                             
   > spawning thread #4: 2 total client(s). 20000 total requests                
                                                             
   > TLS Protocol: TLSv1.3                                                      
                                                             
   > Cipher: TLS_AES_128_GCM_SHA256                                             
                                                             
   > Server Temp Key: X25519 253 bits                                           
                                                             
   > Application protocol: h2                                                   
                                                             
   > progress: 10% done                                                         
                                                             
   > progress: 20% done                                                         
                                                             
   > progress: 30% done                                                         
                                                             
   > progress: 40% done                                                         
                                                             
   > progress: 50% done                                                         
                                                             
   > progress: 60% done                                                         
                                                             
   > progress: 70% done                                                         
                                                             
   > progress: 80% done                                                         
                                                             
   > progress: 90% done                                                         
                                                             
   > progress: 100% done                                                        
                                                             
   >                                                                            
                                                             
   > finished in 3.44s, 29042.21 req/s, 227.72MB/s                              
                                                             
   > requests: 100000 total, 100000 started, 100000 done, 100000 succeeded, 0 
failed, 0 errored, 0 timeout                                   
   > status codes: 100000 2xx, 0 3xx, 0 4xx, 0 5xx                              
                                                             
   > traffic: 784.11MB (822202500) total, 1.15MB (1202140) headers (space 
savings 96.37%), 781.25MB (819200000) data                         
   >                      min         max         mean         sd        +/- sd 
                                                             
   > time for request:      309us     63.06ms      3.37ms      1.43ms    84.61% 
                                                             
   > time for connect:    11.93ms     71.32ms     43.61ms     19.76ms    60.00% 
                                                             
   > time to 1st byte:    74.94ms     76.78ms     75.38ms       517us    90.00% 
                                                             
   > req/s           :    2904.63     2932.24     2911.70        9.42    80.00%
   > ```
   > 
   > 
![image](https://user-images.githubusercontent.com/153144/248157405-0d4162d6-180c-44fd-8259-bd5994b5c968.png)
   > 
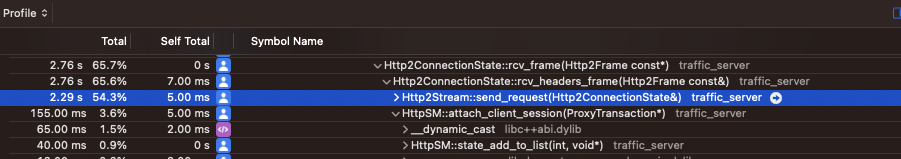
   > ### After (w/ this change)
   > ```
   > $ h2load -n 100000 -m 10 -c 10 -t 5 https://localhost:8443/8k              
                                                          
   > starting benchmark...                                                      
                                                          
   > spawning thread #0: 2 total client(s). 20000 total requests                
                                                          
   > spawning thread #1: 2 total client(s). 20000 total requests                
                                                          
   > spawning thread #2: 2 total client(s). 20000 total requests                
                                                          
   > spawning thread #3: 2 total client(s). 20000 total requests                
                                                          
   > spawning thread #4: 2 total client(s). 20000 total requests                
                                                          
   > TLS Protocol: TLSv1.3                                                      
                                                          
   > Cipher: TLS_AES_128_GCM_SHA256                                             
                                                          
   > Server Temp Key: X25519 253 bits                                           
                                                          
   > Application protocol: h2                                                   
                                                          
   > progress: 10% done                                                         
                                                          
   > progress: 20% done                                                         
                                                          
   > progress: 30% done                                                         
                                                          
   > progress: 40% done                                                         
                                                          
   > progress: 50% done                                                         
                                                          
   > progress: 60% done                                                         
                                                          
   > progress: 70% done                                                         
                                                          
   > progress: 80% done                                                         
                                                          
   > progress: 90% done                                                         
                                                          
   > progress: 100% done                                                        
                                                          
   >                                                                            
                                                          
   > finished in 3.31s, 30198.57 req/s, 236.79MB/s                              
                                                          
   > requests: 100000 total, 100000 started, 100000 done, 100000 succeeded, 0 
failed, 0 errored, 0 timeout                                
   > status codes: 100000 2xx, 0 3xx, 0 4xx, 0 5xx                              
                                                          
   > traffic: 784.11MB (822202500) total, 1.15MB (1202140) headers (space 
savings 96.37%), 781.25MB (819200000) data                      
   >                      min         max         mean         sd        +/- sd 
                                                          
   > time for request:      328us     65.54ms      3.23ms      1.43ms    84.80% 
                                                          
   > time for connect:    12.12ms     74.18ms     46.18ms     20.57ms    60.00% 
                                                          
   > time to 1st byte:    77.60ms     78.46ms     77.90ms       235us    70.00% 
                                                          
   > req/s           :    3020.03     3040.60     3027.50        8.17    80.00%
   > ```
   > 
   > 
![image](https://user-images.githubusercontent.com/153144/248157590-982709dc-7d60-4401-8567-b11ada548ef0.png)
   > 
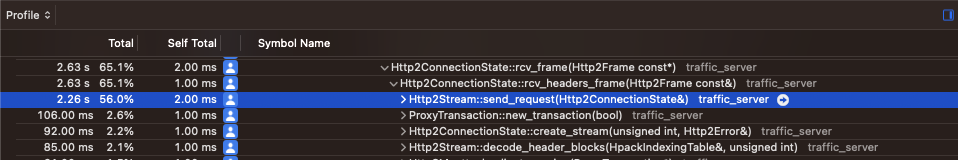
   > `HttpSM::attach_client_session` is gone.
   
   Note that I haven't looked at the new code changes, but this is a 0.03% 
increase in RPS, so not necessarily something I would sacrifice very much code 
readability for :)


-- 
This is an automated message from the Apache Git Service.
To respond to the message, please log on to GitHub and use the
URL above to go to the specific comment.

To unsubscribe, e-mail: [email protected]

For queries about this service, please contact Infrastructure at:
[email protected]

Reply via email to