hi,

I'm new in google api, and not expert in programming :)
I find some examples and I've created a working "corechart".
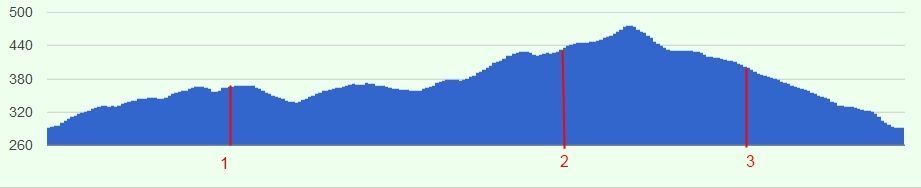
How can I change some bar's color, and how can I add custom labels to the
H-axis for this bars?
Here is a picture what I want to create:

thank's for any help

<https://lh5.googleusercontent.com/-01NNGev9KEc/UOVEUAtTCdI/AAAAAAAABFY/b76b8AavCZA/s1600/corechart_example.jpg>

--
You received this message because you are subscribed to the Google Groups
"Google Visualization API" group.
To view this discussion on the web visit
https://groups.google.com/d/msg/google-visualization-api/-/vp-SNV3FMIMJ.
To post to this group, send email to [email protected].
To unsubscribe from this group, send email to
[email protected].
For more options, visit this group at
http://groups.google.com/group/google-visualization-api?hl=en.