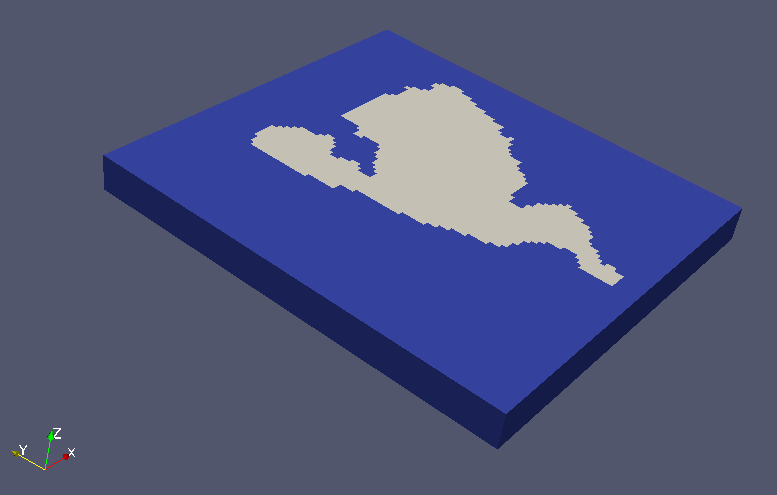
Soeren:

Well, that sort-of worked (at least after I increased the cell size so
paraview didn't crash), but it didn't produce exactly what I was
looking for:
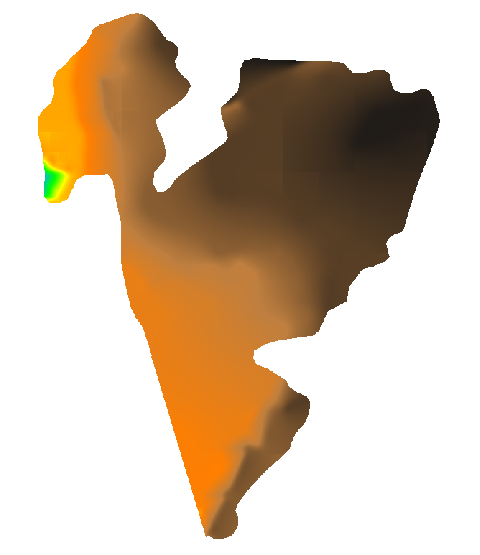
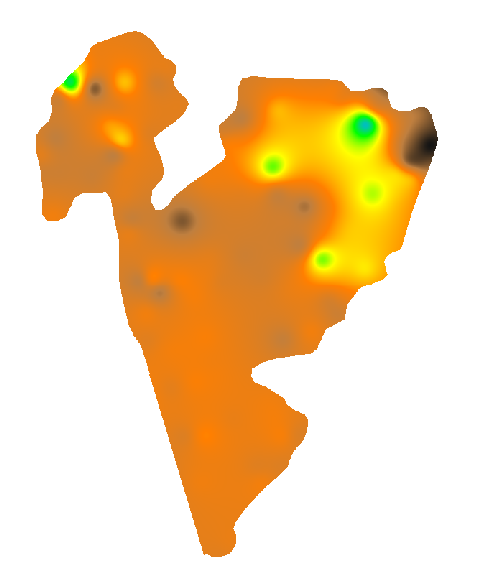
http://public.sundquist.imapmail.org/paraview-2.png

It is basically the rectangular block with the 800 x 900 x 75 foot
dimensions, with the plan-view of the treatment area painted on the top
and bottom (gray one side, red the other side).

And actually, the shape shown on each side is not exactly the treatment
area.  For this test example, the top and bottom surfaces have the same
footprint (i.e. plan view).

Here is the top: http://public.sundquist.imapmail.org/top.png

and here is the bottom: http://public.sundquist.imapmail.org/bottom.png

The bottom side of the "cube" (red outline, no screen shot) is similar
in shape to the input rasters, allowing for increased cell size.

But the top side (grey, in screenshot above) has some sections missing
(for example, the rest of the NW corner).  It shouldn't have had
sectiosn truncated, since my region was set from 0 to 75 feet elevation:

GRASS 6.4> g.region res=1 res3=10 t=75 b=0 tbres=10

and the top and bottom are within these bounds:

GRASS 6.4> r.univar contours
total null and non-null cells: 720000
total null cells: 525599

Of the non-null cells:
----------------------
n: 194401
minimum: 55.2507
maximum: 71.2332
range: 15.9825
mean: 68.4245
mean of absolute values: 68.4245
standard deviation: 2.02751
variance: 4.11078
variation coefficient: 2.96313 %
sum: 13301789.790035248
 100%

GRASS 6.4> r.univar bottom_2
total null and non-null cells: 720000
total null cells: 525599

Of the non-null cells:
----------------------
n: 194401
minimum: 15.5567
maximum: 45.1165
range: 29.5598
mean: 34.7136
mean of absolute values: 34.7136
standard deviation: 3.25303
variance: 10.5822
variation coefficient: 9.37105 %
sum: 6748356.0299701691
 100%

Does it matter that I had different values for res and res3?

J.S.

On Mon, 21 Feb 2011 18:30:36 +0100, "Soeren Gebbert"
<[email protected]> said:
> Hi, try:
>
> r3.out.vtk input=volumemap output=/tmp/volumemap.vtk null=0.0
>
> Open it in paraview and press the Apply button (thats important).
>
> Then choose style -> representation -> surface in the Display tab and
> then color by -> volumemap in the color tab. I suggest you use a
> recent paraview version?
>
> To compute the number of cells between the surface and the bottom use
> r3.mapcalc:
>
> r3.mapcalc "valid_cells = if(volumemap == 1, 1, null())"
>
> r3.univar valid_cells
>
> To avoid large vtk files while testing, you can reduce the region
> resolution with g.region.
>
> Best regards Soeren
_______________________________________________
grass-user mailing list
[email protected]
http://lists.osgeo.org/mailman/listinfo/grass-user